Bitcoin Price Prediction – September 5
The Bitcoin price prediction shows that BTC is shooting close to $51,000 as it has done a little to flip the market sentiment at this stage.
BTC/USD Long-term Trend: Bullish (Daily Chart)
Key levels:
Resistance Levels: $55,000, $57,000, $59,000
Support Levels: $47,000, $45,000, $43,000
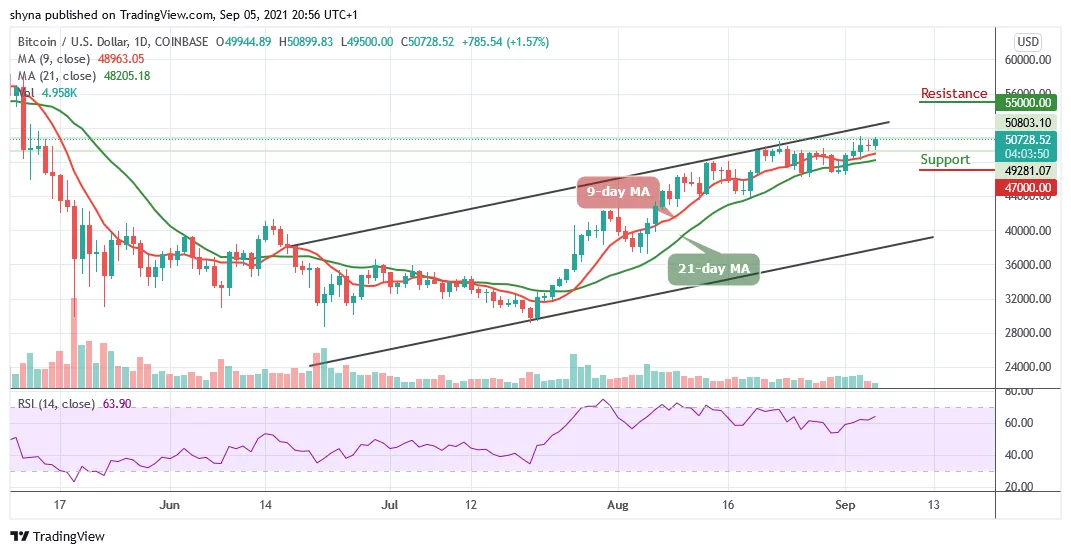
Looking at the daily chart, BTC/USD is correcting gains from $49,500 and it is likely to start a new increase as long as there is no close below $49,000. During the European session today, the Bitcoin price saw a steady increase above the $50,000 resistance level as the coin hovers at $50,728. At the moment, the Bitcoin price keeps hovering above the 9-day and 21-day moving averages.
Bitcoin Price Prediction: BTC Price Ready to Create More Ups
The Bitcoin price is seen retracing and trading above the moving averages as the market price stays under the daily high of $50,967 resistance as a sign of bullish momentum. More so, further increase in the bullish momentum may have to increase the price above this level; another resistance may come at $53,000 before reaching the potential resistance of $55,000, $57,000, and $59,000 levels.
However, if the resistance level of $50,000 failed to hold, it may reverse and face the support level at $48,000; further increase in the bears’ pressure may push down the price towards the lower boundary of the channel and possibly hit the critical supports at $47,000, $45,000, and $43,000. Meanwhile, the technical indicator Relative Strength Index (14) signal line is moving above 60-level to indicate a more bullish movement.
BTC/USD Medium – Term Trend: Ranging (4H Chart)
According to the 4-hour chart, the Bitcoin price is seen trading above the 9-day and 21-day moving averages at $50,936. At the time of writing, the Bitcoin price is moving towards the upper boundary of the channel but any bearish cross below the 9-day moving average may drag the coin to the support level of $50,000 and below.
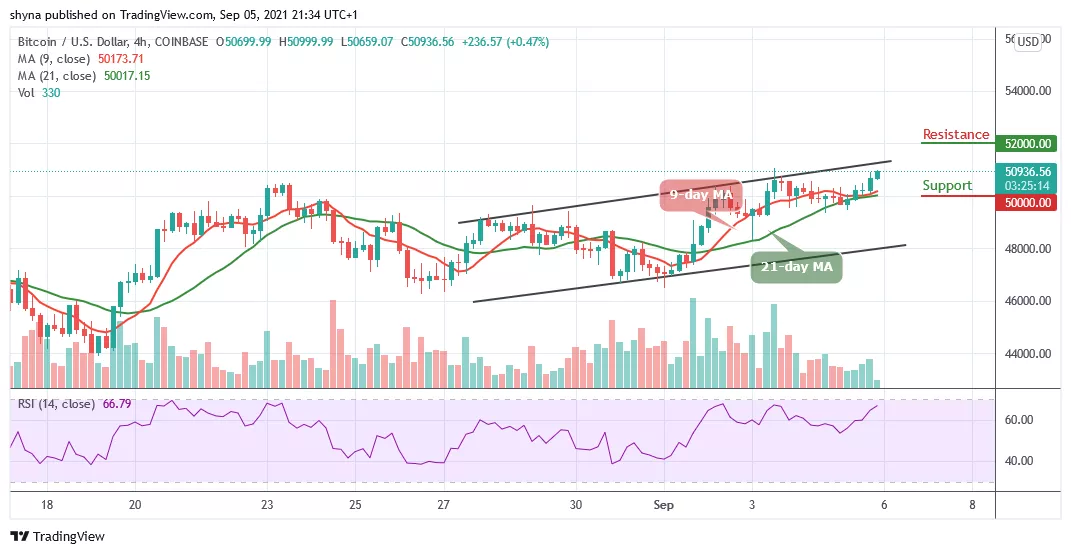
Furthermore, if Bitcoin finds a decent resistance level around $51,000 level, it may start another bullish movement above the upper boundary of the channel which may likely reach the resistance level of $52,000 and above. In other words, the technical indicator Relative Strength Index (14) is seen moving to cross into the overbought region, suggesting additional bullish signals into the market.
Looking to buy or trade Bitcoin (BTC) now? Invest at eToro!
75% of retail investor accounts lose money when trading CFDs with this provider
Read more: