
XRP Holds Sideway Moves – July 13
The trade valuation of XRP/USD holds sideways moves close down to the level of $0.60. The crypto’s percentage rate of trading as of writing; stands at -0.84 to trade at about a point of $0.62.
Holds Sideway Moves: XRP Market
Key Levels:
Resistance levels: $0.80, $1, $1.20
Support levels: $0.50, $0.40, $0.30
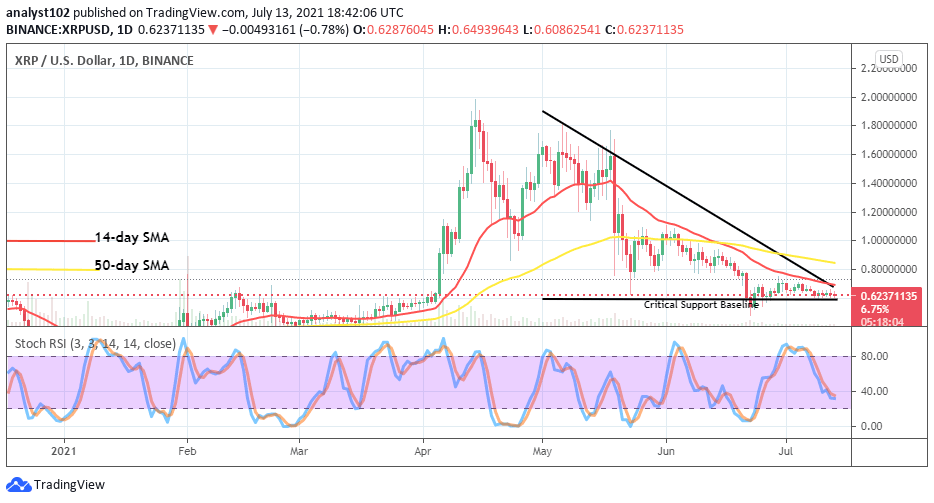
There have a line of lower lows on the Ripple XRP/USD daily chart to show that the crypto’s price holds sideways moves close over the $0.60 mark. The critical support baseline drew at the level earlier mentioned. The bearish trend-line drew southward to touch the smaller SMA at the side of the buy signal, placing a markdown on it. The 50-day SMA indicator is over the 14-day SMA indicator. The Stochastic Oscillators are in the ranges of 40 and 20, briefly pointing toward the south to indicate that some degrees of down may still take place in the crypto’s moving pace.
As the XRP/USD’s price holds sideways moves, will it continue any longer?
There seems that the market may still witness some degrees of down as the XRP/USD’s price holds sideways moves around the level of $0.60. That said, an aggressive downward push against that level will change a short line of bearish trend movement continuation. Such a move will portend a signal that bulls may need to wait until the price pushes further downward for support toward or around the lower level of $0/40 at a later session.
On the downside, the Ripple XRP/USD market bears should hold their positions stronger between the points of $0.80 and $0.60. A line of slow and steady downward push; could most likely ideal for the continuation of the bearish trend of this crypto economy. Nevertheless, traders needed to be cautious of a sudden emergence of a bullish candlestick that may at no time occur during the presumed further lowering course of the market.
XRP/BTC Price Analysis
Comparing the capacity of trending between Ripple XRP and Bitcoin, the price analysis chart reveals that the market holds sideways moves between the smaller SMA and the bullish trend-line that drew below the SMAs. The 50-day SMA indicator is close above the 14-day SMA indicator. The Stochastic Oscillators have slightly swerved northbound between the ranges of 20 and 40. That signifies that the base crypto is warming up for a rebound even as it downsizing pairing with the most expensive counter crypto.
Looking to buy or trade XRP (XRP) now? Invest at eToro!
75% of retail investor accounts lose money when trading CFDs with this provider
Remember, all trading carries risk. Past performance is no guarantee of future results.