Bitcoin Price Prediction – July 9
The Bitcoin price prediction shows BTC bulls moving against the USD at numerous levels which almost touched $33,700.
BTC/USD Long-term Trend: Ranging (Daily Chart)
Key levels:
Resistance Levels: $38,000, $40,000, $42,000
Support Levels: $28,000, $26,000, $25,000
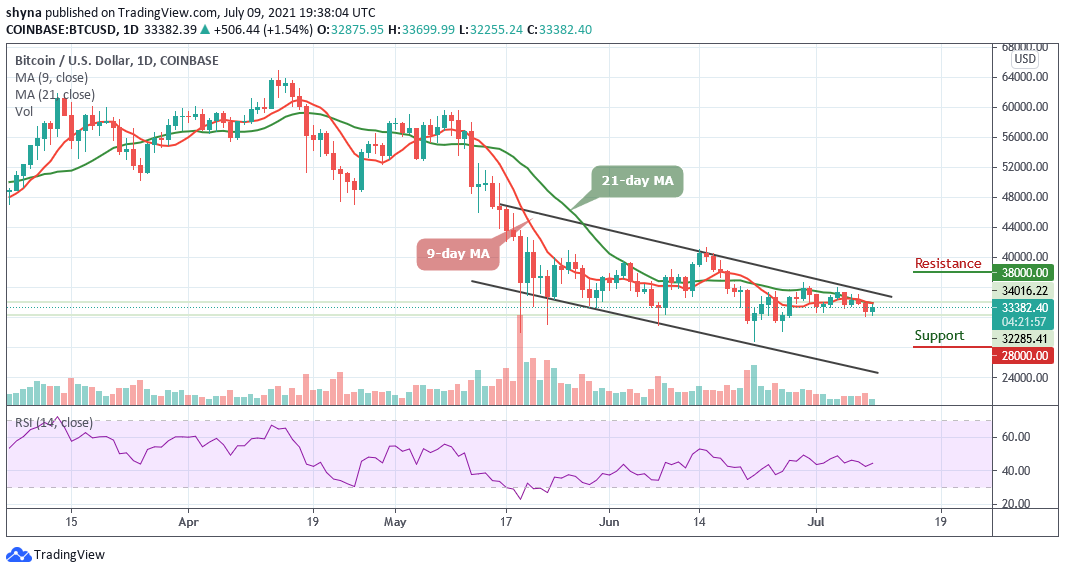
BTC/USD may be resuming its upward movement after a brief dip yesterday bringing the price from $32,875 to $33,699. A couple of days ago, BTC/USD hit just over $35,077 before retreating to a local low of around $32,111 yesterday. However, the price of the leading crypto asset is now heading towards the north, in fact, it is really returning back towards the price levels seen a couple of days ago.
Bitcoin Price Prediction: BTC Price Struggles at $33,000, What Next?
According to the daily chart, the Bitcoin price is now moving above the crucial levels which may now function as the support zones in the event a reversal occurs. On the upside, as the coin moves and prepares to break above the 9-day and 21-day moving averages, little is in place to prevent correction targeting the key resistance of $35,000 as the technical indicator Relative Strength Index (14) moves above 40-level.
Nevertheless, the first digital asset is banking on the support at $30,000 to ensure that in spite of a reversal, the Bitcoin price stays above the $33,500 level. Similarly, the nearest resistance levels to are located at $38,000, $40,000, and $42,000 while the support levels can be reached at 28,000, $26,000, and $25,000 respectively.
BTC/USD Medium – Term Trend: Bearish (4H Chart)
The 4-hour chart shows that the price is on its way down as the Relative Strength Index (14) is seen making a quick turn back below the 50-level to keep the downtrend. Although bulls have been trying to push the price upward for some time now, the market may likely experience more downtrends if the price slides below the 9-day moving average.
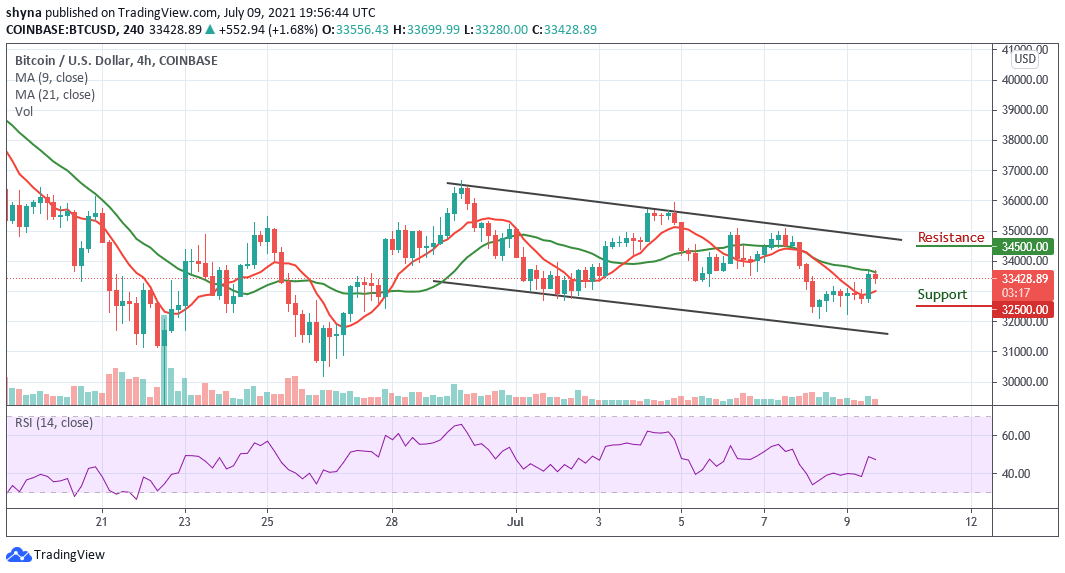
Meanwhile, the support level of $32,500 and below may come into play if the price breaks toward the lower boundary of the channel. But if the buyers can put more effort to power the market; they can push the price towards the upper boundary of the channel where it could hit the targeted resistance level of $34,500 and above.
Looking to buy or trade Bitcoin (BTC) now? Invest at eToro!
75% of retail investor accounts lose money when trading CFDs with this provider