Ripple Price Prediction – September 13
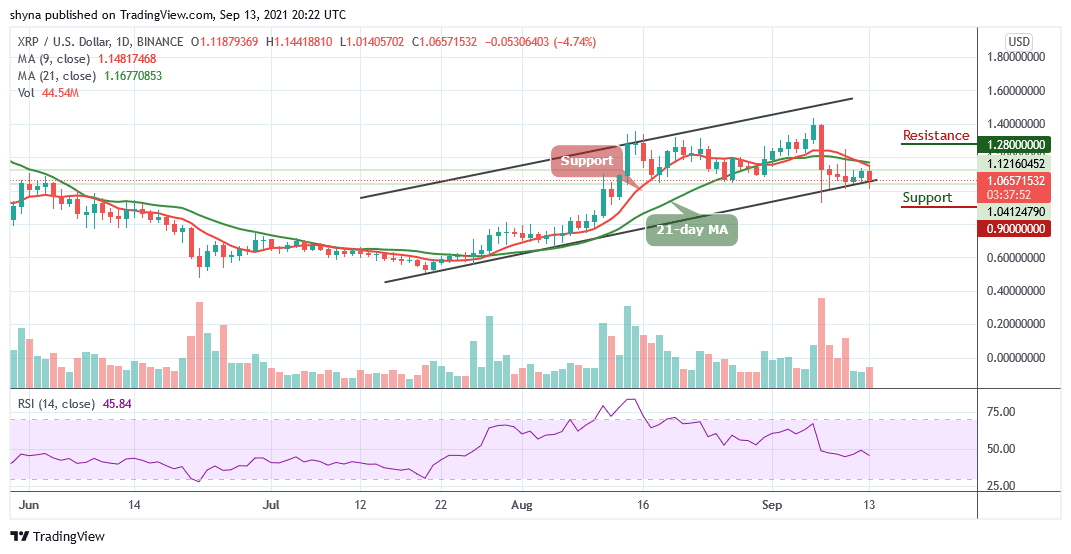
Looking at the daily chart, the Ripple price is seen below the moving averages with 4.09% as the value touches $1.01 support.
XRP/USD Market
Key Levels:
Resistance levels: $1.28, $1.38, $1.48
Support levels: $0.90, $0.80, $0.70

XRP/USD is slowly declining below the lower boundary of the channel as the coin might drop below $1.00 support. After struggling to stay above $1.05, the Ripple price begins a slow and steady decline as the 9-day moving average is seen crossing below the 21-day moving average to move into a short-term bearish zone.
Ripple Price Prediction: Ripple (XRP) May Touch More Supports
At the time of writing, the Ripple price is currently exchanging hands at $1.06 and any attempt to make it cross below the lower boundary of the channel may likely give room for more downsides and the price could spike below the $1.00 support level. However, traders should wait for a bullish cross above the 9-day and 21-day moving averages before creating a new bullish trend at the resistance levels of $1.28, $1.38, and $1.48.
In other words, the market may experience a quick buy once the trade reaches the support at $1.10. And if the price fails to rebound, then a bearish breakout is likely to trigger more selling opportunities for traders, which might cause the price to retest $0.93 and could further drop to $0.90, $0.80, and $0.70 support levels respectively. The technical indicator Relative Strength Index (14) is moving below 50-level, suggesting more bearish signals for the market.
When compares with BTC, the Ripple price is moving sideways as the coin stays below the 9-day and 21-day moving averages. If the selling pressure persists, XRP/BTC may likely create a new low as the technical indicator Relative Strength Index (14) moves below 50-level. In addition, a negative move may come to play in the market as the pair could slide towards the lower boundary of the channel.

However, traders may expect close support at 2300 SAT before breaking to the critical support level of 2100 SAT and below. Meanwhile, if a bullish movement crosses above the moving averages; we can then confirm a bullish movement for the market which could locate the resistance level at 2700 SAT and above.
Looking to buy or trade Ripple (XRP) now? Invest at eToro!
67% of retail investor accounts lose money when trading CFDs with this provider
Read more:
How to buy Ripple
How to buy cryptocurrency