Litecoin Price Prediction – September 16
The Litecoin price prediction shows LTC moving down within the market as its sell-offs may cross below the moving averages.
LTC/USD Market
Key Levels:
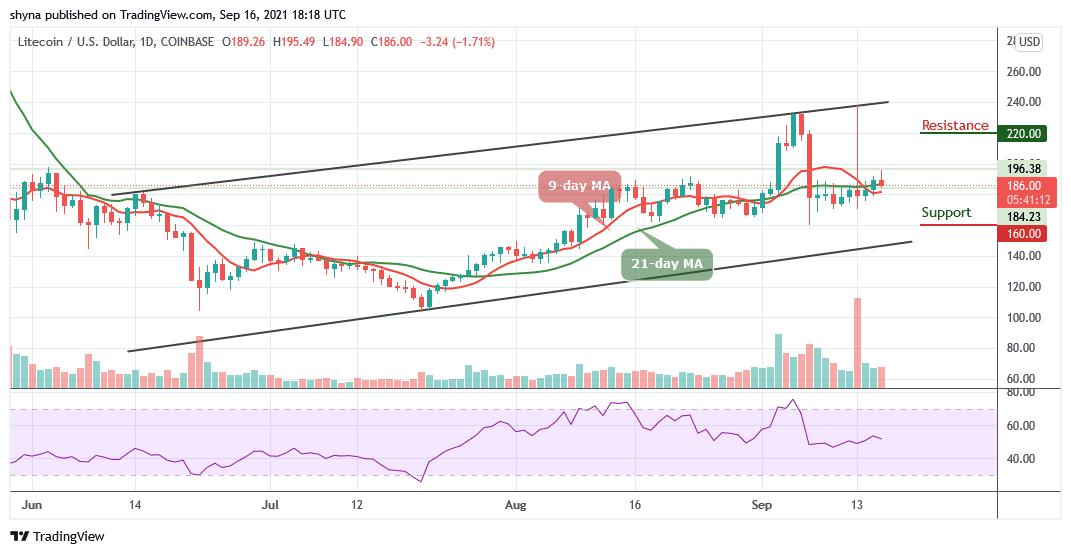
Resistance levels: $220, $230, $240
Support levels: $160, $150, $140

At the time of writing, LTC/USD is changing hands to $186, down from the recent high of $195.49. The coin is seen above the 9-day and 21-day moving averages on the market and it could be mainly influenced by speculative sentiment and technical factors, while fundamental developments remain in the shadows. The cryptocurrency market is known for its behavior because everything grows and falls simultaneously.
Litecoin Price Prediction: Would Litecoin Price Spike or Retreat?
After the Litecoin price tested the resistance level of $195.49, and the bulls failed to hold the ground. The widespread retracement on the market brings the coin towards the nearest support level of $180 with the next local support created by $182.51. This level is likely to limit the correction and serve as a jumping-off ground for another bullish wave.
However, the sell-off is likely to gain traction with the next focus on $160, $150, and $140 support levels. Meanwhile, on the upside, the initial resistance is created by the upper line of the ascending channel. Traders may need to see a sustainable move towards this barrier testing $200 level. The further bullish movement could touch the $220, $230, and $240 resistance levels but traders should consider that the daily Relative Strength Index (14) moves around 51-level, pointing down to the south.

Against Bitcoin, the Litecoin price is moving sideways as it continues to move within the 9-day and 21-day moving averages. The bulls are making an attempt to keep the market above the moving averages as the technical indicator Relative Strength Index (14) is likely to confirm the sideways movement by moving in the same direction. However, the critical support level could be found around the 3600 SAT and below.

Nevertheless, if the bulls strengthen the market, the coin may likely revisit the previous resistance of 4043 SAT before reaching the potential resistance level at 4300 SAT and above. Meanwhile, the price of Litecoin is currently changing hands at 3876 SAT and the coin could slide beneath according to the RSI (14).
Looking to buy or trade Litecoin (LTC) now? Invest at eToro!
67% of retail investor accounts lose money when trading CFDs with this provider
Read more: