The Litecoin price prediction is approaching the $100 support as bearish signals are still widespread within the market movement.
LTC/USD Market
Key Levels:
Resistance levels: $120, $125, $130
Support levels: $85, $80, $75
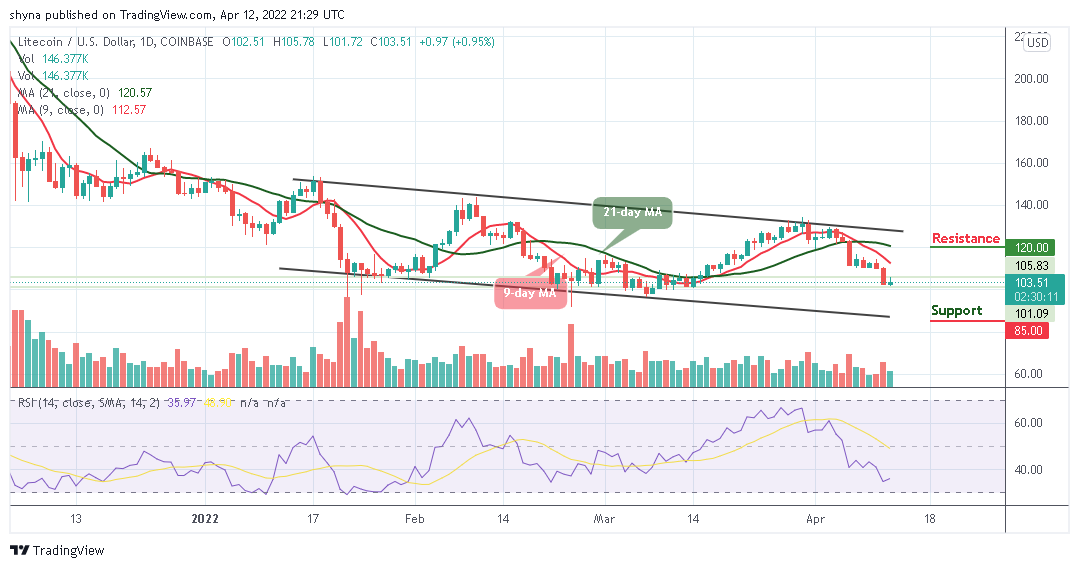
LTC/USD continues to move bearishly as the coin is moving below the resistance level of $105 to touch the nearest support level of $101 while the price remains below the 9-day and 21-day moving averages. Looking at the daily indicator, the Relative Strength Index (14) is seen below 40-level. Therefore, $100 will now be the main level of support that needs to be watched.
Litecoin Price Prediction: LTC Price May Target More Supports
The Litecoin price begins today’s trading with a little rise to $105.78 from the opening price of $102.51, after which the coin retreats to where it is currently trading at a $103.51 level. With this decline, the coin may not be able to maintain its effectiveness before showing more signs of a downtrend.
However, the intraday movement of the coin is clearly shown in the market movement, but starting at $100, a rebound may likely occur, and if the bulls could hold the market and push the Litecoin price to the upside, LTC/USD may cross the 9-day moving average to revisit the resistance levels of $120, $125, and $130 but on the contrary, the continuation of the bearish movement could drag the market towards the lower boundary of the channel which could meet the supports at $85, $80, and $75 respectively.

Against Bitcoin, the Litecoin price has been trading at the downside for the past few weeks. Not quite long, the coin stays below the 9-day and 21-day moving averages, and if the coin continues to move in this way, it may likely hit the support level of 2200 SAT and below.
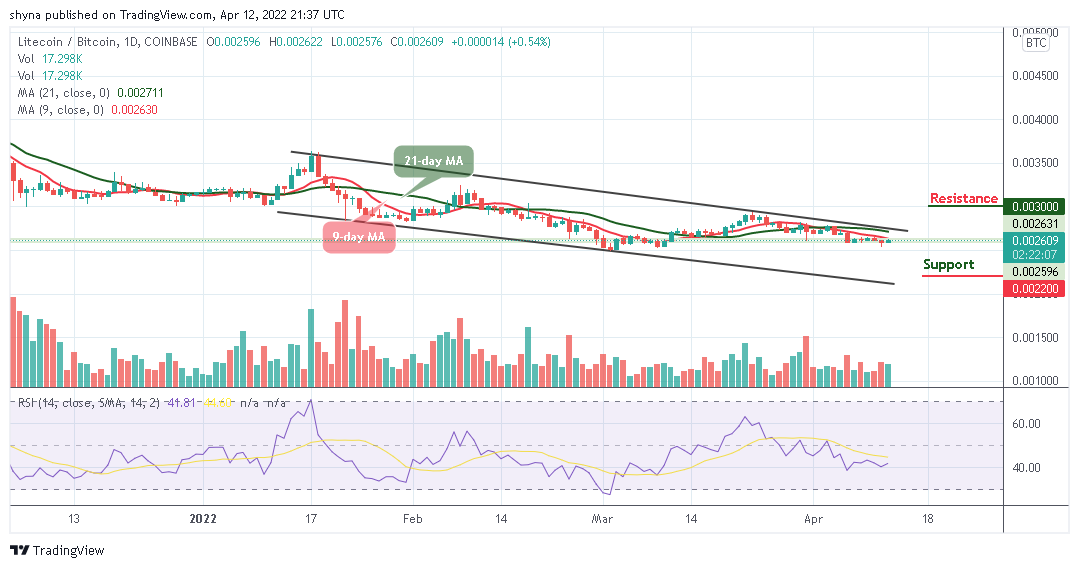
On the contrary, any bullish movement above the 9-day and 21-day MAs could locate the potential resistance level of 3000 SAT and above. Looking at the daily chart, the Litecoin price is currently changing hands at 2609 SAT, and the coin may continue to move sideways as the technical indicator Relative Strength index (14) moves above the 40-level, suggesting a sideways movement.
Looking to buy or trade Litecoin (LTC) now? Invest at eToro!
68% of retail investor accounts lose money when trading CFDs with this provider