Litecoin Price Prediction – July 1
The Litecoin price keeps following a bearish movement within the channel as the technical indicator reveals the next direction.
LTC/USD Market
Key Levels:
Resistance levels: $200, $220, $240
Support levels: $80, $60, $40

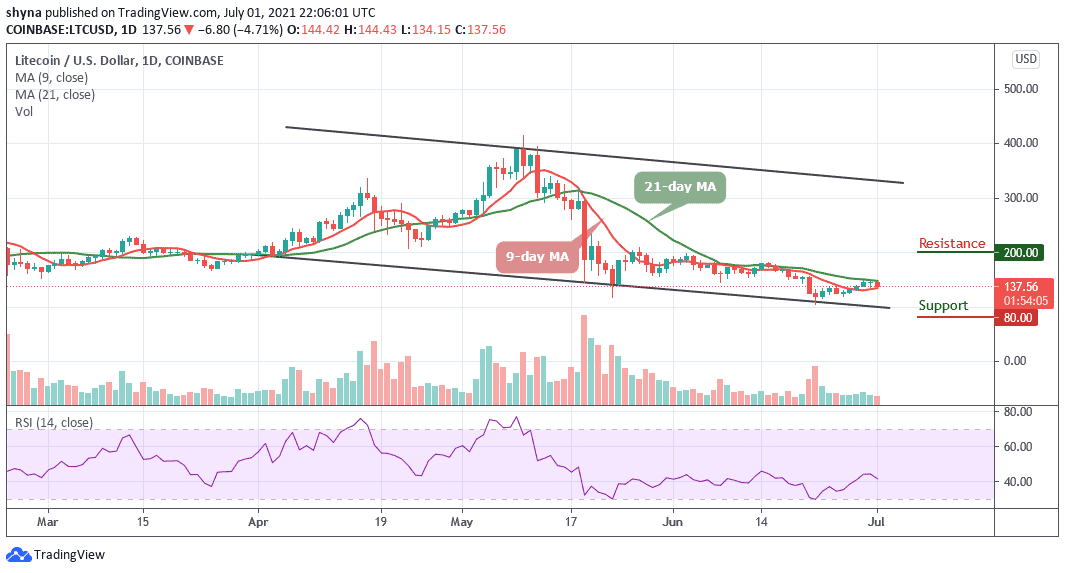
Today, LTC/USD is recording some losses after the improvement that the coin faced for the past few days. The Litecoin price is now hovering around $137.56 where it stays intact within the 9-day and 21-day moving averages. However, after the opening of today’s trading at $144, the Litecoin price moves below $140 support to touch the low of $134. Looking at the daily chart, it seems the Litecoin price may be heading back towards the immediate support level of $130 below the 9-day moving average.
Litecoin Price Prediction: Litecoin Price May Retests $135
As the coin moves within the channel, in as much as the Litecoin price fails to drop from current trading levels, the traders may see the cryptocurrency falling to another trading low. Therefore, a break below the lower boundary of the channel may provoke a dip decline towards the support levels of $80, $60, and $40 levels. Meanwhile, the short-term technical analysis shows that the $135 and $130 levels are currently the strongest forms of technical support.
However, a break above the 21-day moving average may propel the Litecoin price to move towards the nearest resistance level of $170. Furthermore, a bullish push could take the LTC/USD to the resistance levels of $200, $220, and $240 resistance levels. Meanwhile, the Relative Strength Index (14) is currently facing the south as the signal line moves below 45-level which may cause the market to experience more downtrends.
Again Bitcoin, the Litecoin price is following a bullish movement as the coin is trying to cross above the 21-day moving average. As the daily chart reveals, the coin is finding its way above the 9-day moving average because the market movement has been cleared by more green candles since the past few days.

However, as the Relative Strength Index (14) moves around 44-level, a bullish move may likely push the market back to the resistance level of 4500 SAT with a possible break above the 21-day moving average. More so, any further bullish movement above this barrier could hit the resistance level of 4700 SAT and above. In other words, if the Litecoin price crosses below the lower boundary of the channel, it could reach the support level of 3300 SAT and below.
Looking to buy or trade Litecoin (LTC) now? Invest at eToro!
75% of retail investor accounts lose money when trading CFDs with this provider