A bullish divergence after a 13% dip has seen LTC price trend higher, with impetus likely to increase if BTC rallies above $40k
Litecoin price declined by 13.8% on 20 July to see the cryptocurrency trade at lows of $103 as the crypto market battled downward pressure. This week, the LTC/USD pair has continued on a bullish trend with intraweek highs of $140 also highlighting a critical resistance line.
LTC price is currently holding above the bullish trendline around $137, over 6% up on the day and nearly 23% in the green this past seven days. As can be seen in the 4-hour chart below, the Litecoin price forecast for the next few days could include a strong breakout above the $140 level.
The positive outlook will strengthen if Bitcoin breaches and sustains an upside above the $40,000 mark. The benchmark cryptocurrency has tested this price level in deals this morning, after recovering from prices near $36,000 following negative news from Amazon regarding the e-commerce giant’s lack of plans for BTC payments.
According to on-chain data and social behaviour analytics provider Santiment, there’s the possibility of a fresh upward move extending the BTC/USD pair beyond the aforementioned barrier.
📊 How did #Bitcoin recover to $40k out of the blue? 3 of our key leading metrics all skyrocketed! $BTC‘s social and trading volumes both hit a 5-week, and address activity hit a 3-week high. When this trio jumps in unison, good things typically happen. 😎https://t.co/J6aA6M0I6v pic.twitter.com/zhp2p5psFB
— Santiment (@santimentfeed) July 28, 2021
LTC price analysis
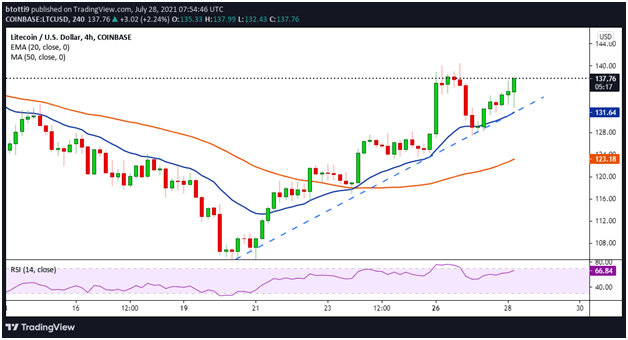
The chart shows bulls are aggressively trying to buy the recent dip as indicated by the long tail on the last candle.
The outlook strengthens the latest uptick in prices and has seen Litecoin continue its bounce off the ascending trendline, which has happened four times in the past week.
The resilience follows a bullish divergence for LTC after a 47.5% increase in unique addresses despite the price shedding 13.8%. Litecoin’s 365-day Market Value to Realized Value (MVRV) ratio also suggests a bounce back is in play after the metric flicked above levels last seen when LTC/USD bottomed in 2019 and 2020.
The 4-hour chart shows technical indicators still favour bulls. The RSI remains positive above 60, the MACD is in the bullish zone and the (primary support) 20 EMA ($131) has its curve rising.
While the price may yet break lower, bulls are likely to have a clear shot at $140 and then $150, or higher, if they keep prices above $130. If LTC/USD turns lower, the next vital support level is currently at $128 and then the 50 SMA on the 4-hour chart ($123).
https://coinjournal.net/news/litecoin-price-analysis-uptrend-has-bulls-trying-to-break-140/