Market Appreciates Gradually – July 4
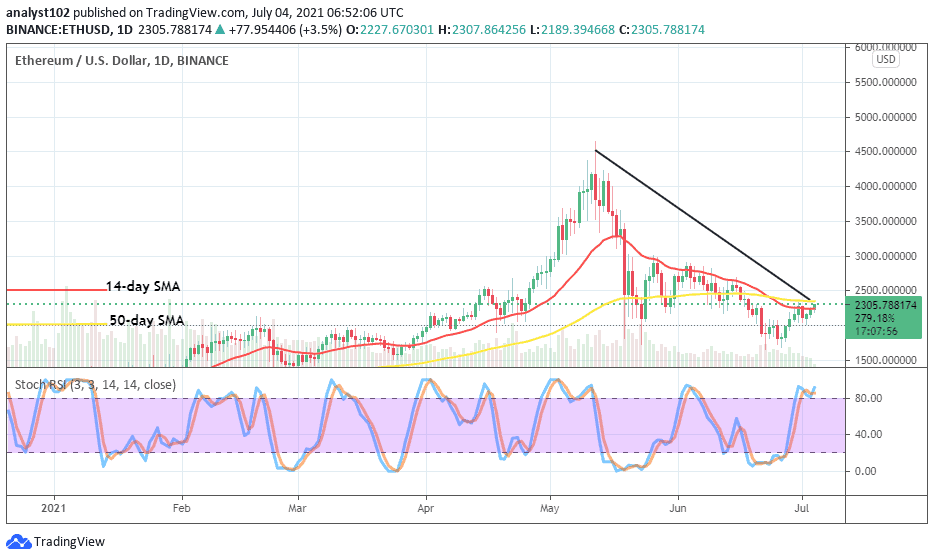
The trading activity featuring Ethereum and the US fiat currency now appreciates gradually after the recent panic sell-trading situations. The crypto’s valuation, as of writing, stands at about $2,320 at a positive percentage rate of around 4.14.
Market Appreciates Gradually: ETH Market
Key Levels:
Resistance levels: $2,500, $3,000, $3,500
Support levels: $2,000, $1,800, $1,600
On the ETH/USD daily trading chart, it shows currently that a bullish candlestick is forming tightly against the sell signal side of the bigger SMA to signify that the crypto market appreciates gradually. The 50-day SMA is positioning to point to the east closely above the 14-day SMA trend-line as the bearish trend-line drew downward to touch the bigger SMA in a supportive manner. The Stochastic Oscillators are in the overbought region, with the lines trying to cross northbound indicate that buying pressure is relatively ongoing.
Will the valuation of the ETH/USD increase further as the crypto market currently appreciates gradually?
It is being showcased on the chart that the ETH/USD currently appreciates gradually; the kind of momentum that bulls have gathered seems not strong enough to launch another buy entry at this time. Only those entries that might have placed below the level of $2,000 may allow running further, probably until the next immediate resistance level of $2,500 before considering profit takings.
On the downside, rejection is expected to come up around the level of $2,500. In the aftermath days’ trading sessions, a downward force should take form by featuring a bearish candlestick around that trading position to signify a re-emergence of downward movement of the market again. Traders needed to be cautious of repositioning their stances while playing alongside the presumed market’s scenario.
ETH/BTC Price Analysis
There has now been that Ethereum’s price currently appreciates gradually against Bitcoin in the comparison. The ETH/BTC price analysis chart shows some variant smaller candlesticks being formed closely on the north side of the smaller SMA. The 50-day SMA indicator and the bullish trend line tightly conjoined below the 14-day SMA trend line. And, they all point toward the north to indicate that the base crypto is on an appreciating motion pairing with the flagship counter crypto. The Stochastic Oscillators are in the overbought region in an attempt to cross the lines northbound further. Yet, that signifies that ETH may still have a better chance of trending furthermore pairing with Bitcoin in the near session.
Looking to buy or trade Ethereum (ETH) now? Invest at eToro!
75% of retail investor accounts lose money when trading CFDs with this provider