Ethereum Price Prediction – July 1
The Ethereum price is approaching crucial support and the price must hold the $2200 level to climb towards $2500.
ETH/USD Market
Key Levels:
Resistance levels: $2900, $3100, $3300
Support levels: $1600, $1400, $1200

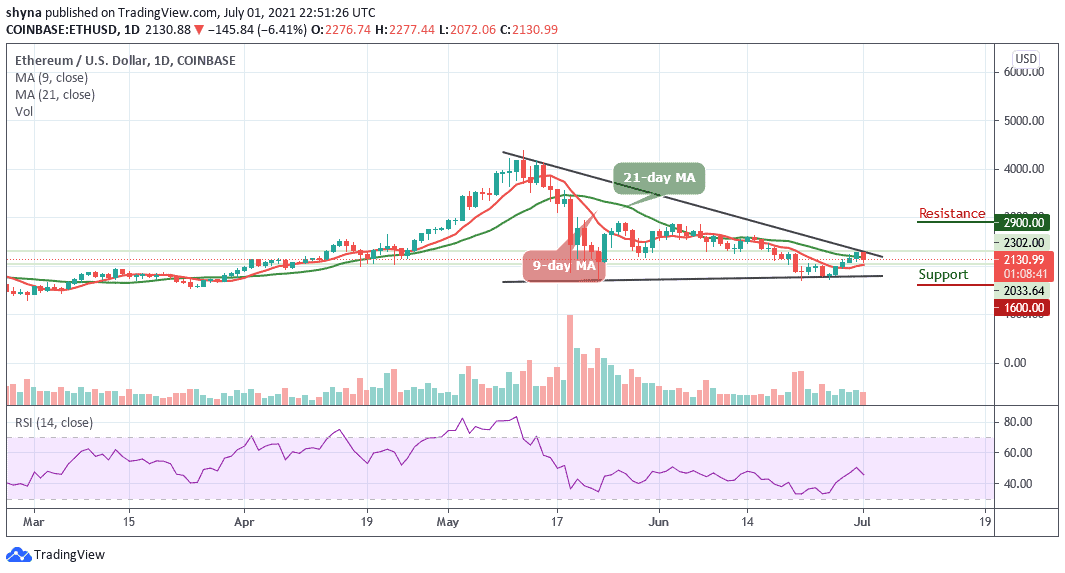
ETH/USD is trading down 6.41% at its current price of $2130.99, which marks a notable decline from its daily highs of $2277 that was set today when the bulls attempted to spark another rally. However, in the near term, Ethereum (ETH) has been able to find some support in the lower $2072 level, as it has bounced multiple times after visiting these levels.
Ethereum Price Prediction: Ethereum Price Could Drop More
After several bullish movements, the Ethereum (ETH) has been bitten today by the bear as the coin is currently experiencing a price drop. Before this, many traders were expecting a lot from the coin after touching the resistance level of $2288 yesterday reflecting an improvement in the Ethereum prices. However, the Ethereum price is currently moving under the 21-day moving average which is yet to break out below the 9-day moving average within the channel.
Moreover, a bearish drop may continue to roll the market down towards the lower boundary of the channel and this could hit the support levels of $1600, $1400, and $1200 while a possible bullish surge could drive the market above the upper boundary of the channel to touch the $2700 level. Meanwhile, the $2900, $3100, and $3300 may further provide resistance levels for the market. Therefore, the Relative Strength Index (14) is facing the negative side, and staying there would cause the coin to drop more.
Against Bitcoin, the market price remains within the channel as the bears are trying to step back into the market. ETH/BTC is currently trading at 6348 SAT and the bulls couldn’t keep the price above the 9-day and 21-day moving averages. However, if the Ethereum price continues to drop and cross below the lower boundary of the channel, the next key supports could be at 5600 SAT and below.

Meanwhile, on the upside, a possible bullish movement towards the upper boundary of the channel may likely push the market to the upside. Once this is established, the resistance level of 7300 SAT and above could be visited. On the contrary, the Relative Strength Index (14) is trying to cross below 50-level, suggesting that the market may continue to fall.
Looking to buy or trade Ethereum (ETH) now? Invest at eToro!
75% of retail investor accounts lose money when trading CFDs with this provider