Bitcoin Price Prediction: August 15
The Bitcoin price is down from $48,149 to $45,555 in the last 2 days as there is no quick recovery that seems possible for the coin at the time of writing.
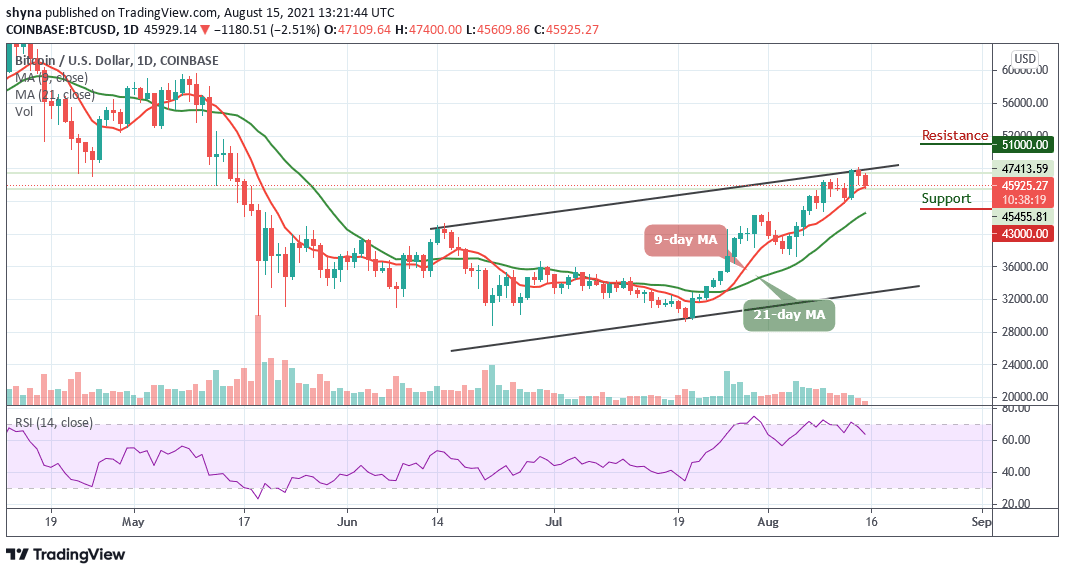
BTC/USD Long-term Trend: Bullish (Daily Chart)
Key levels:
Resistance Levels: $51,000, $53,000 $55,000
Support Levels: $43,000, $41,000, $39,000
At the time of writing, BTC/USD is facing a setback but the coin is likely to have a bullish run in the short-term while a bullish pressure may help the coin to touch its daily high. Currently, the Bitcoin price is trading around $45,925 level after a free fall from $47,400 a few hours back and the coin has shown tremendous volatility over the past few days.
Bitcoin Price Prediction: Is Bitcoin Price Ready for the Downside?
As the daily chart reveals, the Bitcoin price failed to cross above the upper boundary of the channel. However, the coin may touch the low of $44,000, if the price should slump below the $45,000 level; the 9-day moving average could be an important barrier to keep an eye on. Therefore, crossing below this barrier could hit the supports at $43,000, $41,000, and $39,000, which could make room for BTC to fall even further.
On the other hand, the technical indicator Relative Strength Index (14) is moving around 70-level. Therefore, if the king coin decides to move above the channel, BTC/USD may locate the resistance levels of $51,000, $53,000, and $55,000. However, Bitcoin is still expected to bounce back above $47,000 in order to complete its correction.
BTC/USD Medium-term Trend: Bullish (4H Chart)
On the 4-hour chart, the Bitcoin price surges upward catapulting its price to cross above the 9-day and 21-day moving averages. After touching the daily high of $47,400 today, the coin begins to drop in price to where it’s trading currently at $46,494. Therefore, should the market price drops further; it could reach the nearest supports at $45,000, $43,000, and $41,000 respectively.
Moreover, if the bulls push the coin above the moving averages, the Bitcoin price could hit the resistance at $47,000 before heading to the potential resistance levels of $48,000, $50,000, and $52,000. More so, the market is likely to follow a bullish trend as the Relative Strength Index (14) indicator moves above 50-level.
Looking to buy or trade Bitcoin (BTC) now? Invest at eToro!
75% of retail investor accounts lose money when trading CFDs with this provider