Bitcoin Price Prediction – July 7
The Bitcoin price is currently moving below $35,000 after the king coin hits an intraday high of $35,077.
BTC/USD Long-term Trend: Ranging (Daily Chart)
Key levels:
Resistance Levels: $38,000, $40,000, $42,000
Support Levels: $31,000, $29,000, $27,000
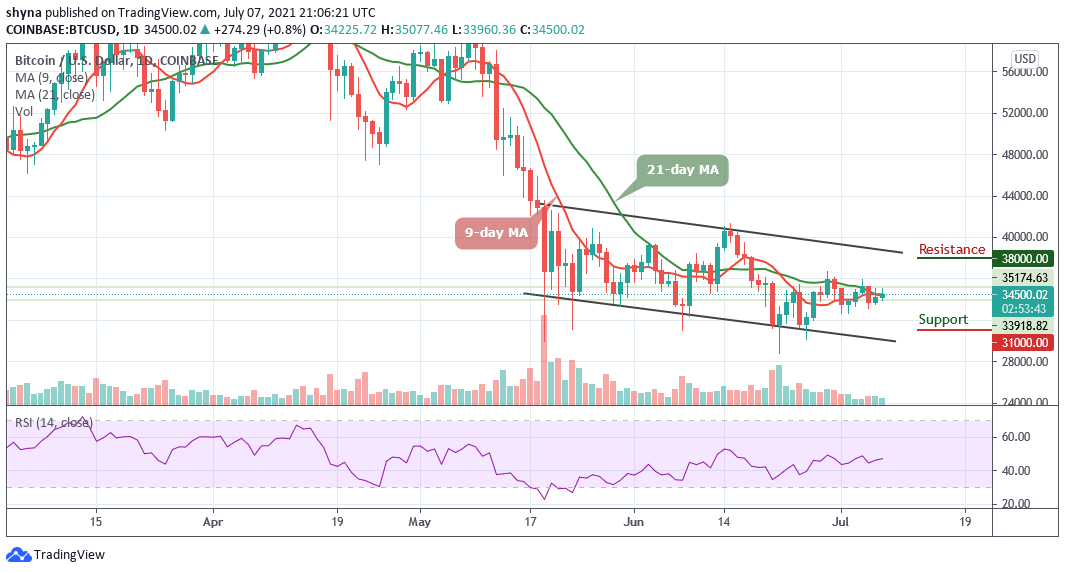
At the time of writing, BTC/USD is hovering around the $34,500 level after touching the daily high of $35,077. Meanwhile, there has been a lot of sluggish movement in the market as neither the bulls nor the bears are looking to hold the price by the scruff of its neck.
Bitcoin Price Prediction: What Could Trigger Fresh Rally?
As the Bitcoin price hovers around the 9-day and 21-day moving averages, the price must close above $36,000 to indeed indicate an upside opening on the daily chart. Previously, the price range between $33,500 and $35,000 acted as support. However, for BTC/USD to turn bullishly, the bulls take it out decisively to turn it into support once again and then continue the momentum forward where it could reach $38,000, $40,000, and $42,000 resistance levels.
Currently, Bitcoin’s rise may likely give other altcoins a much-needed boost and also calm the cryptocurrencies market as well. Therefore, for Bitcoin to be rejected at $34,000, the drop may lead to a decline towards the lower boundary of the channel. Should in case the coin falls more, it could rely on the long-term support levels at $31,000, $29,000, and $27,000 as the Relative Strength Index (14) moves in the same direction.
BTC/USD Medium-term Trend: Ranging (4H Chart)
Looking at the 4-hour chart, the Bitcoin price is facing a downtrend and the coin may continue to depreciate if the $34,000 level is broken. The 9-day MA is likely to cross below the 21-day MA, the Bitcoin price may fall and could reach the critical support at $33,000, and below.
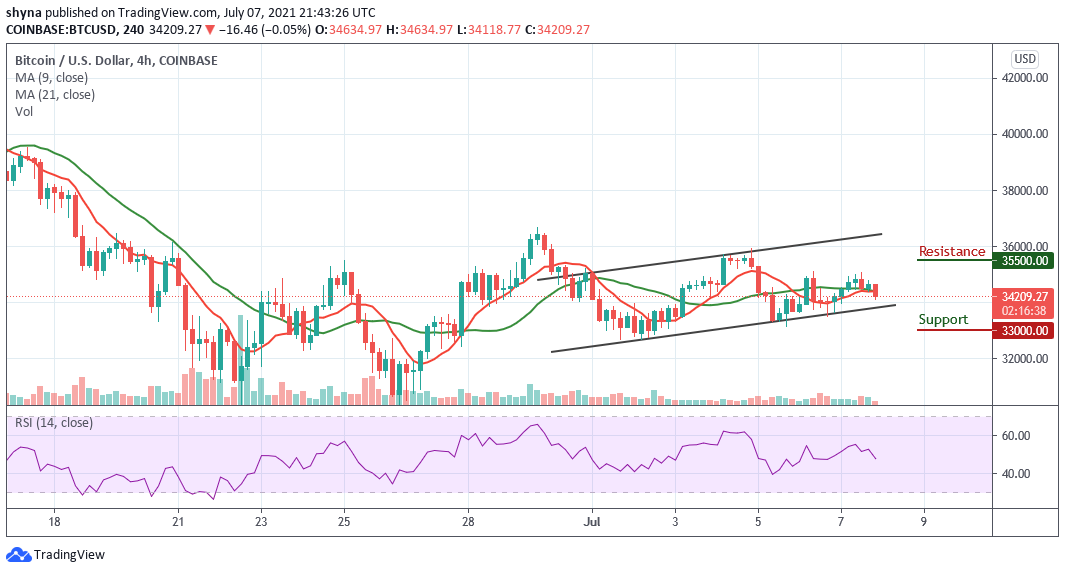
However, if the bulls can hold the current price and push the coin back above the 9-day and 21-day moving averages, it could hit the potential resistance at $35,500, and above. Meanwhile, the technical indicator Relative Strength Index (14) is currently facing the south, suggesting more bearish signals into the market.
Looking to buy or trade Bitcoin (BTC) now? Invest at eToro!
75% of retail investor accounts lose money when trading CFDs with this provider