Ripple Price Prediction – October 1
The Ripple price prediction shows that XRP is lacking imminent support within the market and may continue to trade in the red.
XRP/USD Market
Key Levels:
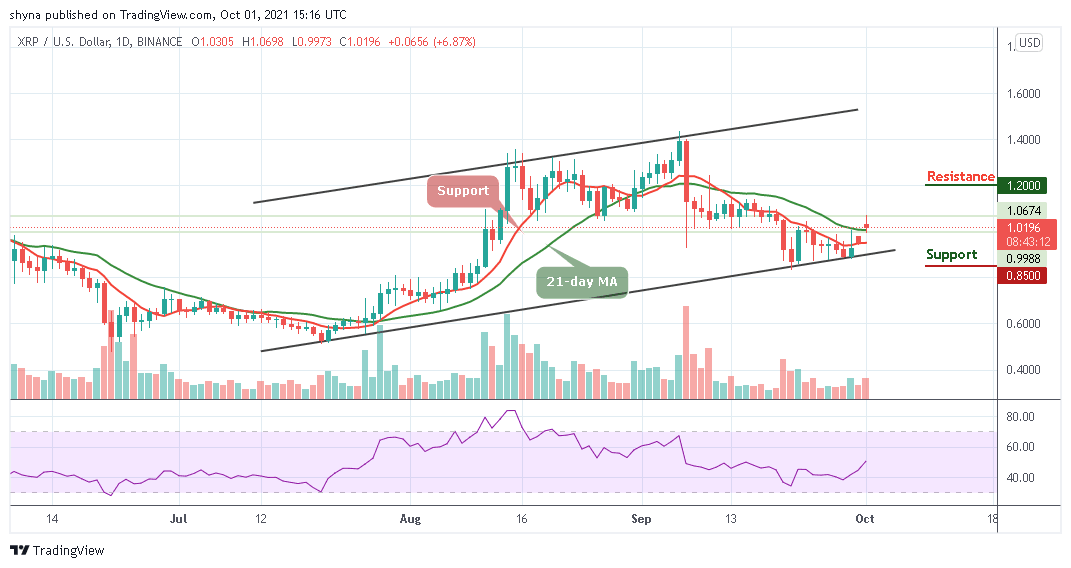
Resistance levels: $1.20, $1.25, $1.30
Support levels: $0.85, $0.80, $0.75

At the time of writing, XRP/USD is now correcting downwards after having hit the resistance at $1.06. However, the king coin (Bitcoin) is seen trading above $47,000 and has an impact on the overall trading volume and market cap as well. Currently, the Ripple coin is exhibiting an intraday dip and bearish move, alongside, lack of support.
Ripple Price Prediction: XRP Price Could Fall More
The daily chart reveals that the Ripple Price is seen correcting downwards after having soared at $1.06 resistance but unable to hit the higher resistance. The coin is now moving towards the major support at $1.00 but hovering around $1.02 support. However, the moment the coin rightly gains the required momentum, it is ought to bounce back and retest the formed resistance.
At the moment, the technical indicator Relative Strength Index (14) faces the north with its signal lines pointing to the north. Should the bulls prevail over the bears by keeping the price back above the 9-day and 21-day moving averages; XRP/USD may rally towards the $1.20, $1.25, and $1.30 resistance levels. In other words, if the bears continue to push the price below the moving averages; the price could find its low at the support levels of $0.85, $0.80, and $0.75 respectively.

Against Bitcoin, for the past few days now, Ripple (XRP) has been consolidating below the 9-day and 21-day moving averages but the coin is yet to slum below the lower boundary of the channel as bulls may try to step back into the market. During the European session today, the coin touches the resistance level of 2259 SAT, traders can expect a price rise to the resistance level of 2400 SAT and above.

However, if the sellers push the price down towards the lower boundary of the channel, the next support level could be located at 2000 SAT and further support may be found at 1900 SAT and below. Meanwhile, the technical indicator Relative Strength Index (14) is moving in the same direction, causing the market to move sideways.
Looking to buy or trade Ripple (XRP) now? Invest at eToro!
67% of retail investor accounts lose money when trading CFDs with this provider
Read more: