The Ripple price prediction is trading around the support level of $0.71 as the coin heads toward the lower boundary of the channel.
XRP/USD Market
Key Levels:
Resistance levels: $0.85, $0.90, $0.95
Support levels: $0.60, $0.55, $0.50
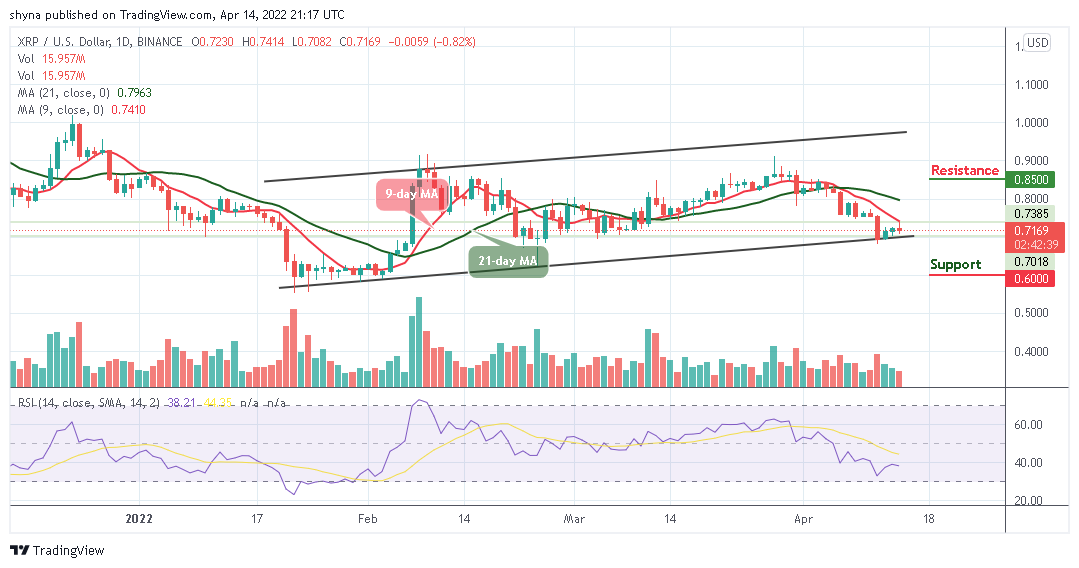
Looking at the daily chart, XRP/USD is likely to head to the downside. Though, the Ripple price may be stagnant, trending in a tight trade range as it could move below the key supports. The coin may likely revisit the $0.70 support before it could start a new increase, but after struggling to face the 9-day moving average, Ripple (XRP) begins a slow and steady decline towards the south. According to the technical indicator, the coin may hit the nearest support at $0.65 to move into a short-term bearish zone.
Ripple Price Prediction: Ripple (XRP) May Stay at the Downside
At the time of writing, the Ripple price is currently exchanging hands at $0.71, and any attempt to make it cross below this level may likely open the doors for more downsides, and the price could spike below the $0.68 support level. However, traders may need to keep their eyes on the $0.80 before creating a new bullish trend at the resistance levels of $0.85, $0.90, and $0.95.
Moreover, it is likely for traders to experience a quick buy once the trade reaches the support at $0.70, but, if the price fails to rebound, a bearish breakdown would trigger more selling opportunities for the market, which might cause the price to locate the critical supports at $0.60, $0.55, and $0.50. Meanwhile, the technical indicator Relative Strength Index (14) moves below the 40-level, and Ripple (XRP) may continue to fall more if the bears increase the selling pressure.

When compared with Bitcoin, the Ripple (XRP) is moving in the same direction within the channel. If the selling pressure persists, the Ripple price may bring a new low into the market. Presently, the technical indicator Relative Strength Index (14) is moving towards 50-level; more positive moves may come to play as the coin moves to cross above the 9-day and 21-day moving averages.
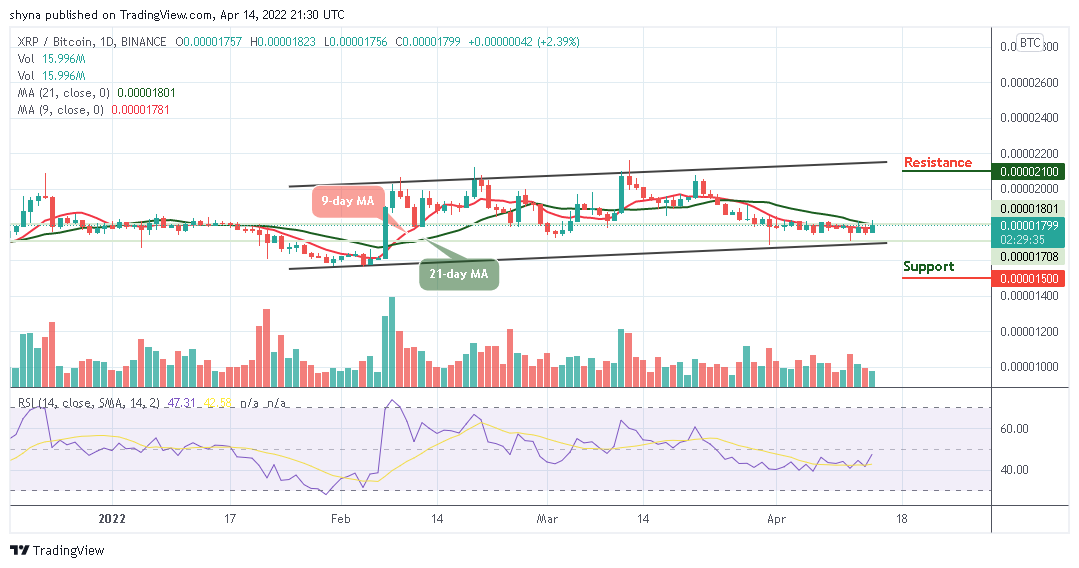
However, traders may expect close support below the moving averages at the 1600 SAT before breaking to 1500 SAT and below. If a bullish movement surfaces, validating a break above the 21-day moving average may confirm a bullish movement, and the nearest resistance level may be located at 2100 SAT and above.
Looking to buy or trade Ripple (XRP) now? Invest at eToro!
68% of retail investor accounts lose money when trading CFDs with this provider