Ripple Price Prediction – October 6
The Ripple price is improving as the coin is now facing up in an intraday zone above the moving averages.
XRP/USD Market
Key Levels:
Resistance levels: $1.30, $1.35, $1.40
Support levels: $0.85, $0.80, $0.75
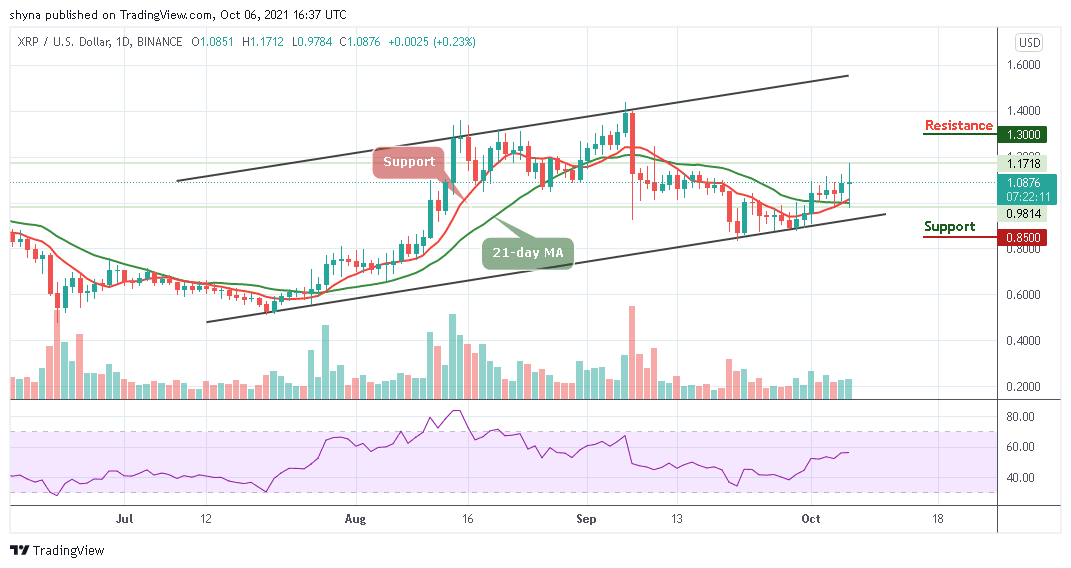
XRP/USD is now hovering above the 9-day and 21-day moving averages amid global recovery on the cryptocurrency market. The Ripple price keeps improving as the coin touched the intraday high at $1.171 level. At the time of writing, XRP/USD is still warming up to gain more upsides as the technical indicator Relative Strength Index (14) moves to cross above 60-level.
Ripple Price Prediction: Can Ripple (XRP) Gain More Upsides?
Looking at the daily chart, the red-line of 9-day MA is crossing above the green-line of 21-day MA to continue the upward movement. However, if the Ripple price crosses below the moving averages, it may turn bearish and a break below the lower boundary of the channel could start to put the coin back to the negative side.
Meanwhile, if buyers can keep the movement above the 9-day and 21-day MAs, the first level of resistance could be found at $1.20 level; any further bullish movement above this level may hit the potential resistance at $1.30, $1.35, and $1.40 levels. On the downside, the support at $0.90 should be able to hold the current movement. If the market pushes beneath, the market may turn bearish and further support levels are located at $0.85, $0.80, and $0.75.

When compares with Bitcoin, the Ripple price is still following the bearish movement and if the selling pressure increases, XRP/BTC price may create a new monthly low. At the moment, the technical indicator Relative Strength Index (14) remains beneath; traders may experience more downtrends within a short time as the signal line moves into the oversold region.
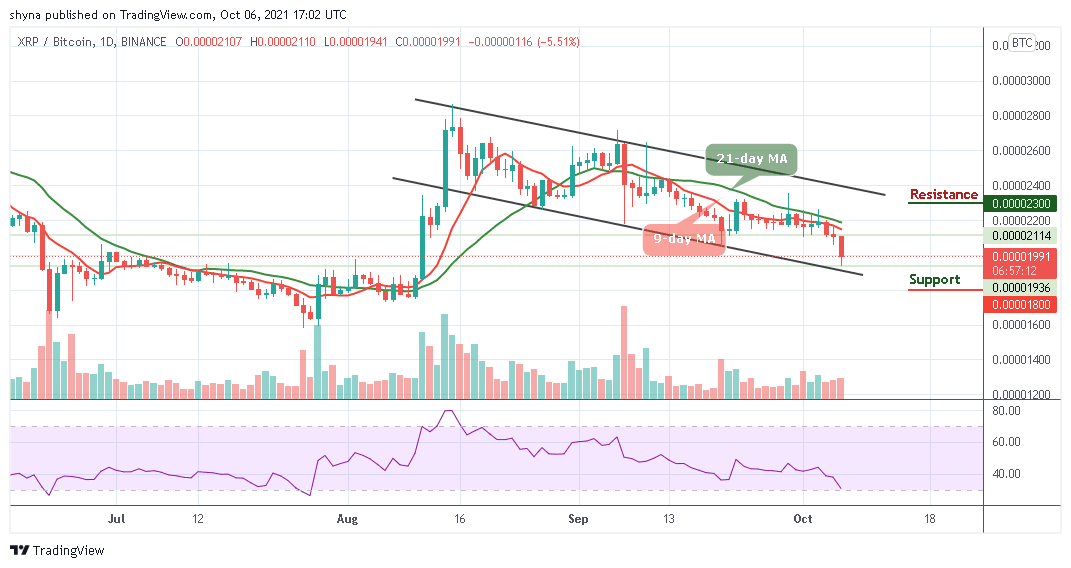
However, the Ripple is currently trading at 1991 SAT, which is below the 9-day and 21-day moving averages. Any bearish cross below lower boundary of the channel may hit the critical support at 1800 SAT and below. On the other hand, if a breakout above the 9-day and 21-day moving averages surfaces; there may be a confirmation of an upward move for the market and the next resistance level may be located at 2300 SAT and above.
Looking to buy or trade Ripple (XRP) now? Invest at eToro!
67% of retail investor accounts lose money when trading CFDs with this provider
Read more:

