Ripple Price Prediction – August 13
The Ripple price prediction is getting more comfortable as the price pushes above $1.05 with a daily increase of over 8.9%
XRP/USD Market
Key Levels:
Resistance levels: $1.200, $1.250, $1.300
Support levels: $0.850, $0.800, $0.750

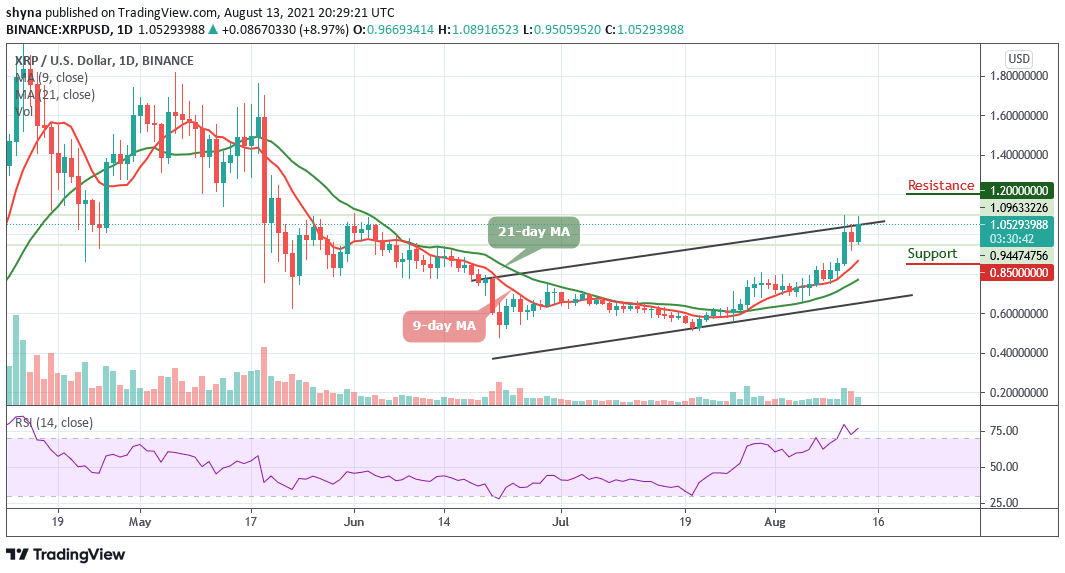
XRP/USD settles above $1.085 amid global recovery on the cryptocurrency market as the coin has gained nearly 9% in the recent 24 hours and touches the intraday high at $1.089 before retreating to $1.052. Yesterday, the Ripple price had previously dropped after the cryptocurrency failed to overcome resistance at the $1.049 level which caused it to roll over and fall.
Ripple Price Prediction: Ripple Price Ready to Climb Higher
As the technical indicator, the Relative Strength Index (14) moves within the overbought region, and a crossing above the upper boundary of the channel may confirm that the Ripple price is heading towards the next potential resistances. Meanwhile, if the price collapses below 9-day and 21-day moving averages, the market will turn bearish, and critical support levels could be reached at $0.850, $0.800, and $0.750 respectively.
Moreover, if the buyers can break above the channel at $1.100, the first level of resistance lies at the $1.150 level. Any further movement above this could lead to the resistance levels of $1.200, $1.250, and $1.300 as the technical indicator swims within the overbought zone. Meanwhile, entering into this zone may further confirm the bullish trend.
By Comparing it with Bitcoin, the Ripple price is currently moving at the upside of the channel and the price action has remained intact within the channel in as much as the buying pressure continues. At the moment, the signal line of the Relative Strength Index (14) may soon cross into the overbought region; traders may continue to see a positive move in the market as much as the coin stays above the upper boundary of the channel.

However, the Ripple price is currently moving at 2232 SAT which is around the upper boundary of the channel. Therefore, traders may expect close resistance at 2300 SAT before breaking to 2500 SAT and above. However, should in case a bearish movement occurs and validates a break below 2100 SAT; the market may experience a bearish movement and the nearest support level is located at 2000 SAT and below.
Looking to buy or trade Ripple (XRP) now? Invest at eToro!
75% of retail investor accounts lose money when trading CFDs with this provider