Litecoin Price Prediction – August 26
The Litecoin price prediction faces a sharp price decline of around 5.62% at the time that the market opens and it currently trades at $168.06.
LTC/USD Market
Key Levels:
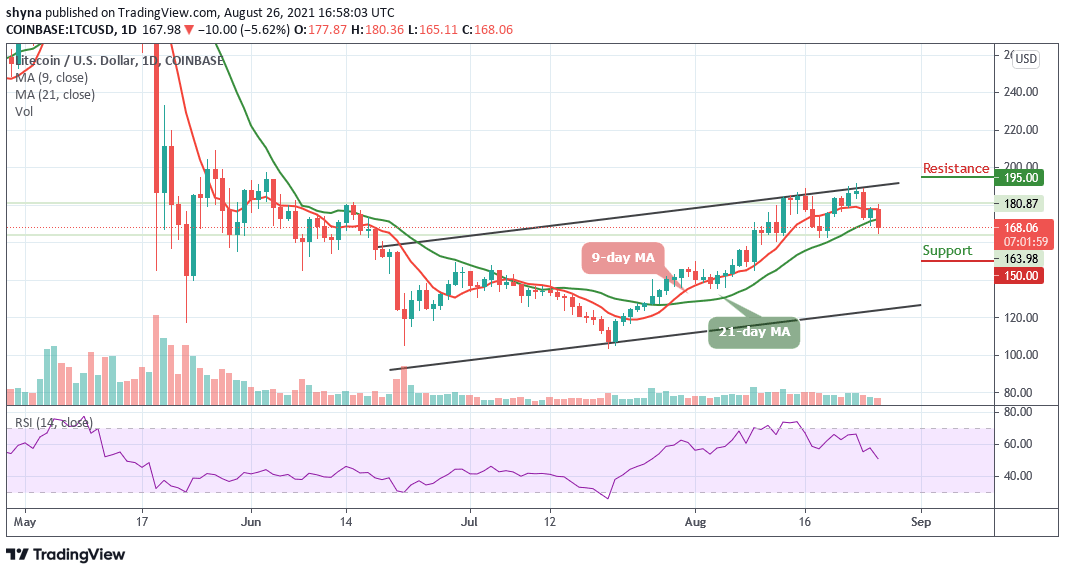
Resistance levels: $195, $205, $215
Support levels: $150, $140, $130

LTC/USD is trading in the negative as the coin falls below the 9-day and 21-day moving averages. After touching the daily high of $180.36, the Litecoin price failed to break this level before it’s been rejected. However, for the Litecoin price to continue the upward movement; it may need to climb above the upper boundary of the channel convincingly and a clear break about this barrier could take the coin up to the $200 level.
Litecoin Price Prediction: The Litecoin Price May Set Lower
According to the daily chart, the Litecoin price touches the daily low of $180.36, therefore, if the nearest support of $160 gives way, the sell-off may come to play and it may be extended towards the support level of $155 as sellers may control the market if the bears begin to post firm commitment as the Relative Strength Index (14) shows a bearish movement, indicating the latest selling pressure on the market.
In addition, traders could see a sharp drop below $150 support. Breaking this level could weaken the market further to $140 and $130 supports. However, a possible upward reversal is likely to retest the previous resistance level above the upper boundary of the channel. In the meantime, if the buyers manage to fuel the market, traders can expect a further increase to the resistance levels of $195, $205, and $215.
Against Bitcoin, the Litecoin price continues to follow a downward trend. Now, the coin is trading below the 9-day and 21-day moving averages and we can therefore expect support near the 3500 SAT before falling to 3300 SAT and critically 3200 SAT as the technical indicator Relative Strength Index (14) is likely to drop below 40-level.

Moreover, there is no sign of a bullish movement for the Litecoin market at this time, but if a bullish move occurs and validates a break above the 9-day and 21-day moving averages, the coin may reach the closest resistance at 3800 SAT. Immediately after this, traders can confirm a bullish movement as the nearest resistance is at 4000 SAT and 4200 SAT.
Looking to buy or trade Litecoin (LTC) now? Invest at eToro!
75% of retail investor accounts lose money when trading CFDs with this provider