The Ethereum price prediction may gain ground towards $3500 as the recovery above $3200 could help to mitigate any incoming pressure.
ETH/USD Market
Key Levels:
Resistance levels: $3800, $4000, $4200
Support levels: $2400, $2200, $2000
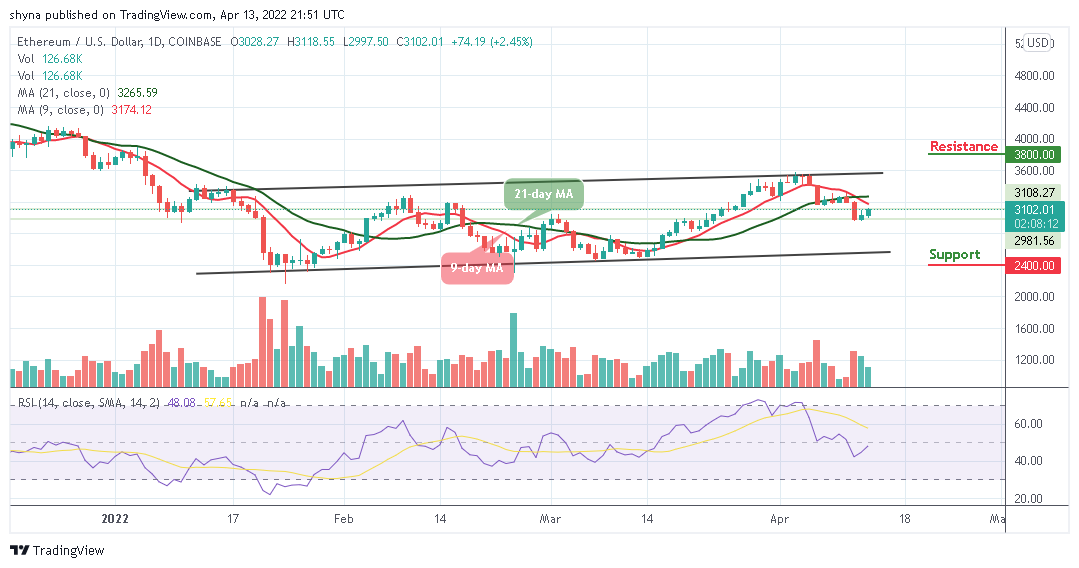
ETH/USD is hovering above $3100 as the coin prepares to gain more bullish signals. The movement to the upside has not allowed the market to bow to the selling activity under $3000 early this morning. At the moment, Ethereum (ETH) is trading towards the 9-day and 21-day moving averages. In the short term, bearish momentum is very likely especially if the bulls fail to hold the price above $3200 and the support at the lower boundary of the channel is broken.
Ethereum Price Prediction: Would Ethereum (ETH) Break Higher?
The Ethereum price may need to rise and break above the 9-day and 21-day moving averages before resuming the previous bullish trend but may break beneath $3100 before resuming higher. Therefore, if the sellers push lower, traders can expect very strong support at $2800; this is then followed up with support at $2600. If the bears push further below, additional supports may be located at $2400, $2200, and $2000.
On the other hand, if the buyers regroup and rebound from $3100, the first level of resistance could be found at $3500. This may be followed by reaching the potential resistance levels at $3800, $4000, and $4200 while the Relative Strength Index (14) moves to cross above 50-level to indicate an average bullish movement within the market. Meanwhile, if the technical indicator dips beneath this level, the Ethereum price may head lower to the downside.

When compared with Bitcoin, the Ethereum price keeps moving sideways as the coin trades at 7535 SAT, and the bulls couldn’t push the price to the north. However, if the price drop below the 9-day and 21-day moving averages, the next key support may be located at 6800 SAT and below.
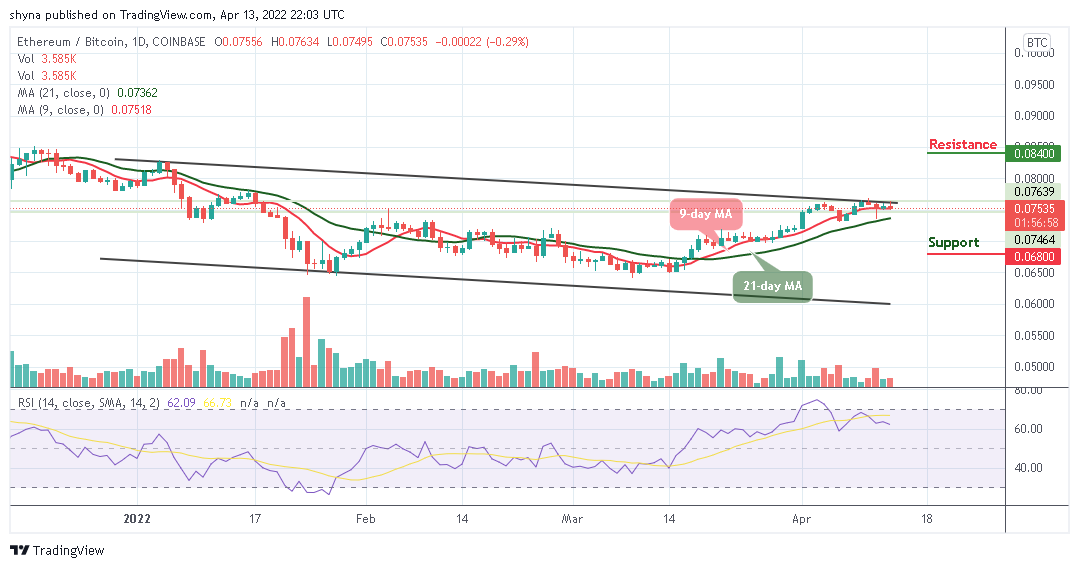
However, a possible bullish movement could push the market to cross above the upper boundary of the channel, a break above this barrier may enable ETH to reach a high of 8400 SAT and above, but the Relative Strength Index (14) remains above 60-level, which shows that the market might experience a sideways movement.
Looking to buy or trade Ethereum (ETH) now? Invest at eToro!
68% of retail investor accounts lose money when trading CFDs with this provider