Ethereum Price Prediction – August 26
The Ethereum price prediction shows ETH moving below the key supports as it may continue to move down if it fails to stay above the $3000 level.
ETH/USD Market
Key Levels:
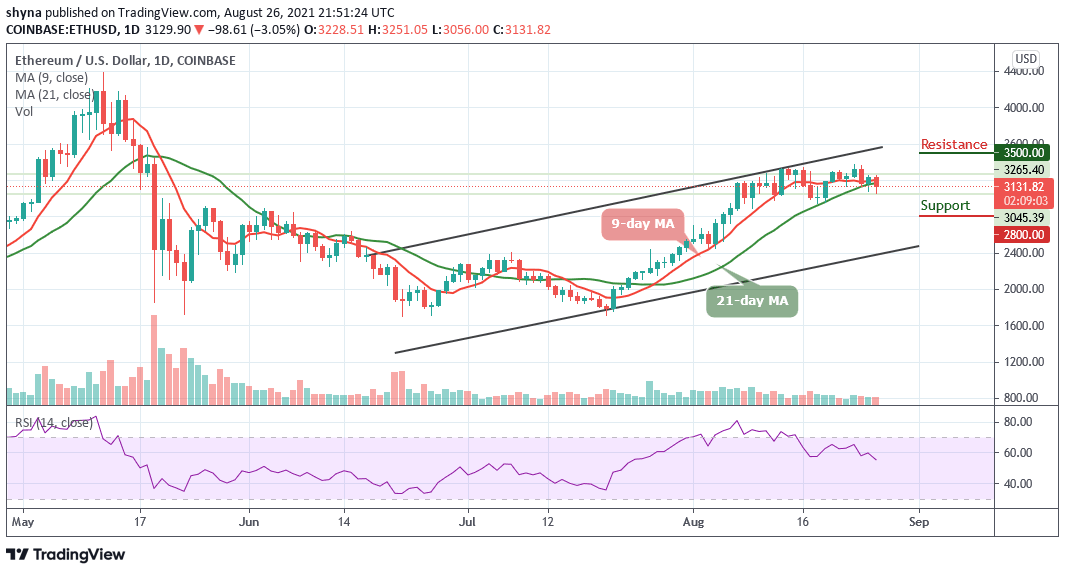
Resistance levels: $3500, $3700, $3900
Support levels: $2800, $2600, $2400

ETH/USD is seen dropping with a bearish bias after the coin opens at $3228, it is currently dropping below the 9-day and 21-day moving averages. As the daily chart reveals, the Ethereum price is bearish for today as the market retraced over the last 24 hours to reach the daily low of around $3056. However, the second digital asset may correct higher, but it is likely to face the downside below the 21-day moving average.
Ethereum Price Prediction: Ethereum Not Ready for a Breakout
As the Ethereum price follows the downside, there could be a close below the $3000 level as the coin is seen sliding below the moving averages. However, as a matter of fact, dropping further could open the doors for more losses and the Ethereum price may tumble below the $2900 level. However, should it spike below this level, the critical support levels of $2800, $2600, and $2400 may come into focus as the technical indicator Relative Strength Index (14) nosedives below the 60-level.
On the contrary, ETH/USD could either recover above $3200 or extend its decline. If the coin decides to follow the uptrend and crosses above the 9-day and 21-day MAs, the next major resistance could be located at around $3400 level. Nevertheless, the price may climb above the $3500, $3700, and $3900 resistance levels to move back into a positive zone.
Against Bitcoin, bears are trying to step back into the market while the coin shows some negative signs that could make lower lows if the price stays below the 9-day and 21-day moving averages. On the downside, the nearest level of support lies at 0.064 BTC and below this, critical support lies at 0.062 BTC.

Moreover, when looking from the upside, the nearest resistance level is 0.068 BTC and above this, further resistance lies at 0.070 BTC and above. The technical indicator Relative Strength Index (14) is moving below 50-level and it is likely for the coin to cross above the moving averages if the bulls put more effort.
Looking to buy or trade Ethereum (ETH) now? Invest at eToro!
75% of retail investor accounts lose money when trading CFDs with this provider