Ethereum Price Prediction – April 6
The Ethereum price prediction sees a 4.78% price fall within a few hours of trading as it drops back towards $3200.
ETH/USD Market
Key Levels:
Resistance levels: $4000, $4200, $4400
Support levels: $2800, $2600, $2400
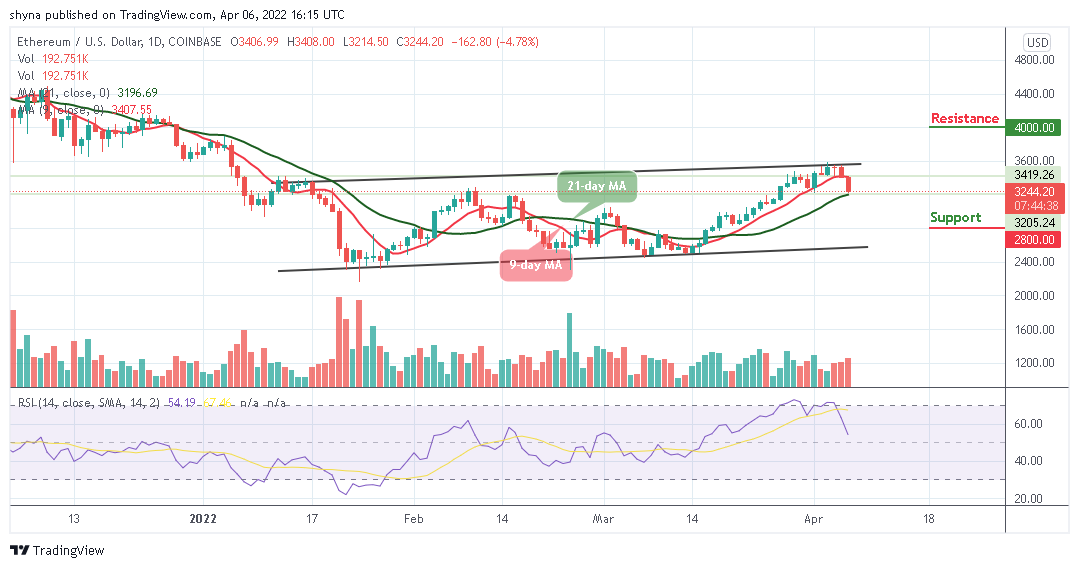
ETH/USD is currently declining, and the second-largest crypto trades are below the 9-day moving average. The Ethereum price is holding the $3200 support level, but there is a possibility of downward movement in the nearest term. The coin is currently moving near the 21-day moving average, and it could decline towards the $3000 support as the technical indicator faces the south.
Ethereum Price Prediction: Ethereum (ETH) May See a Further Downside?
If there is an upside break above $3300, the Ethereum price could revisit the resistance level of $3500. Any further gains might push the price towards the $4000, $4200, and $4400 resistance levels. On the downside, the $3000 level is the nearest support. If there are more downsides, the price could test the critical support levels of $2800, $2600, and $2400, where the bulls are likely to take a stand.
In the meantime, ETH/USD is yet to show some positive signs at the time of writing, but it could dip further in the short term. Having said that, the Ethereum price may likely bounce back above the 9-day moving average, as long as there is no daily close below the 21-day moving average. However, the Relative Strength Index (14) is heading towards 50-level, indicating a bearish movement.

Against Bitcoin, the Ethereum price is now trading below the 9-day moving average within the descending channel as the bears are coming to dominate the market. ETH/BTC is currently trading at 7378 SAT, and the bulls couldn’t push the price to the north. Looking at the chart, if the price continues to drop, the next key supports may likely be at 6800 SAT and below.
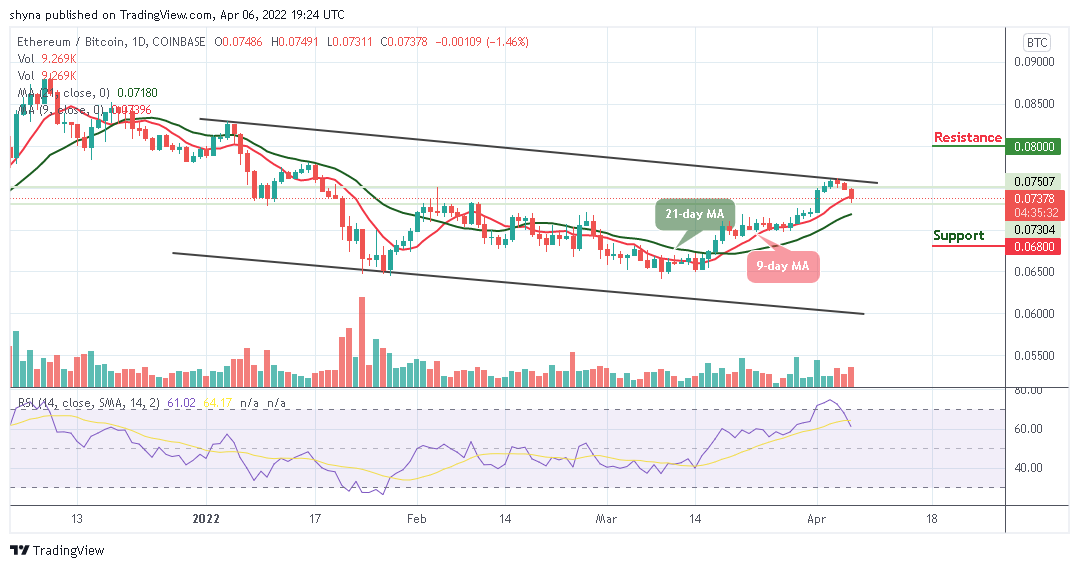
However, any possible bullish movement could push the market above the 9-day moving average within the channel, a break above the upper boundary of the channel may enable the Ethereum price to reach the resistance level of 8000 and above but the Relative Strength Index (14) is likely to cross below 60-level, which shows that the market might experience more downtrends.
Looking to buy or trade Ethereum (ETH) now? Invest at eToro!
68% of retail investor accounts lose money when trading CFDs with this provider