Bitcoin Price Prediction – July 14
The Bitcoin price rebounds from the early dip at $31,600 as the buying interest may increase on approach to $33,000.
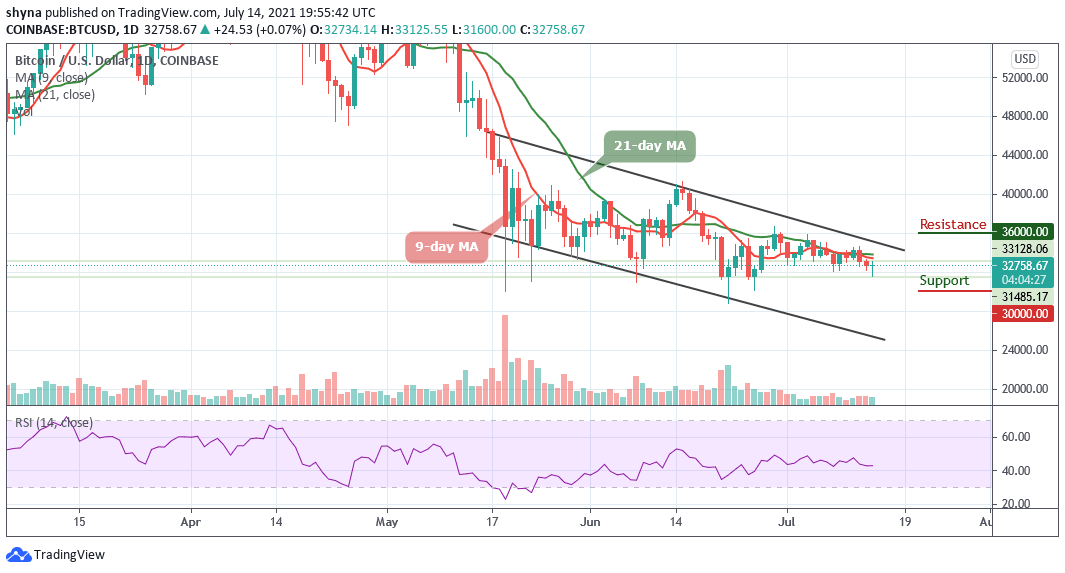
BTC/USD Long-term Trend: Bearish (Daily Chart)
Key levels:
Resistance Levels: $36,000, $38,000, $40,000
Support Levels: $30,000, $28,000, $26,000

BTC/USD is bearish as the market established a lower low around $31,600 but currently rebounding to retest previous support at $33,000. The bulls are finding some stiff resistance around the $32,758 on the road to recovery and the path of least resistance appears to the upside in the near term amid a favorable bullish technical setup.
Bitcoin Price Prediction: BTC Price Could Head to the North
In the past few hours, after the Bitcoin price touches the daily low of $31,600, the king coin has been facing the resistance level of $32,800 and looking forward to touching another resistance level of $33,000. However, the daily chart reveals that if the 9-day moving average crosses above the 21-day moving average, this will determine the next direction that the coin will follow. On the other hand, the Bitcoin price may decline if the $32,000 support breaks down but the price could rise if the $35,000 resistance is touched.
Meanwhile, the technical indicator Relative Strength Index (14) is in a range as the signal line point to the east, indicating a sideways movement. Therefore, if the Bitcoin price crosses above the 9-day and 21-day MAs, it could hit the resistance levels of $36,000, $38,000, and $40,000 but moving towards the lower boundary of the channel could meet the supports at $30,000, $28,000, and $26,000.
BTC/USD Medium-Term Trend: Ranging (4H Chart)
According to the 4-hour chart, the Bitcoin price is seen rebounding as the technical indicator Relative Strength Index moves above 40-level after the king coin touches the low of $31,600. On the upside, if the Bitcoin price stays above the 9-day MA in the short term, bullish influence could spike and the accrued gains massively.

However, the current candle could fall to a tentative support level below the 9-day MA at $32,200. However, the ultimate target remains at $32,000 and below and the best the bulls can do is to hold above the weak support at $33,000 and keep their attention on breaking the resistance at $33,800 and above.
Looking to buy or trade Bitcoin (BTC) now? Invest at eToro!
75% of retail investor accounts lose money when trading CFDs with this provider