Bitcoin Price Prediction – April 5
The Bitcoin price prediction shows that BTC keeps trading below the 9-day moving average as the coin touches $45,475 support.
BTC/USD Long-term Trend: Ranging (Daily Chart)
Key levels:
Resistance Levels: $51,000, $53,000 $55,000
Support Levels: $42,000, $40,000, $38,000
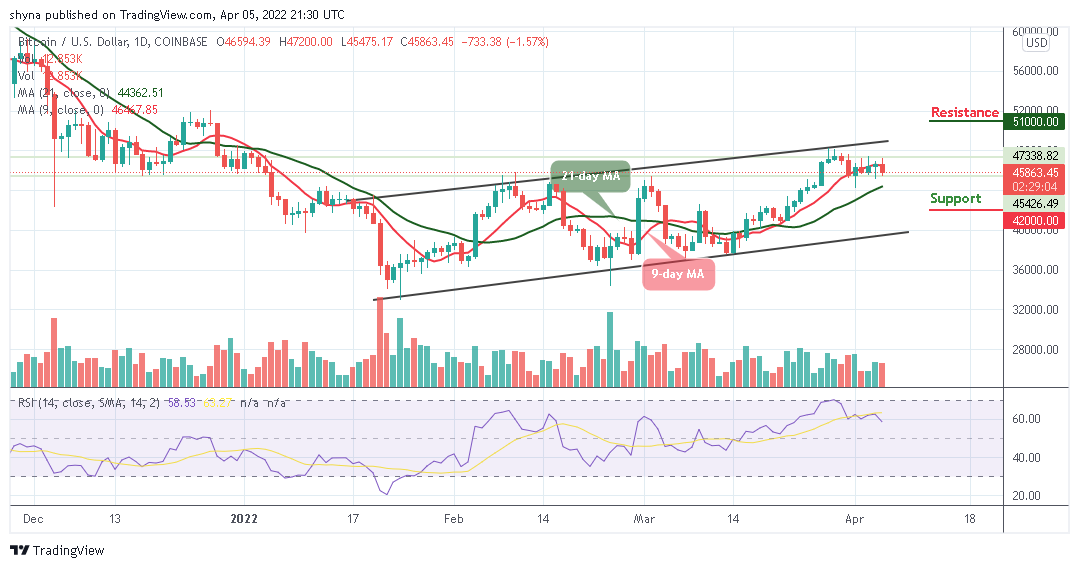
BTC/USD is facing a setback as the king coin heads to the downside. The Bitcoin price is likely to have a bearish run in the short term as the technical indicators confirmed. Currently, Bitcoin (BTC) is trading around the $45,863 level after a free fall from $47,200 during the European session today.
Bitcoin Price Prediction: Bitcoin (BTC) May Head to the Downside
Looking at the daily chart, the Bitcoin price is currently nose-diving below the 9-day day moving average. However, if the price slumps below the support level of $45,000, the king coin is likely to gain more downtrends, further bearish movement could locate the supports at $42,000, $40,000, and $38,000, making room for BTC to fall even further.
In the meantime, the technical indicator Relative Strength Index (14) is moving to cross below 60-level as the trading volume could be in support of the bears. Moreover, if the bulls decide to push the price above the 9-day moving average, BTC/USD may likely cross above the upper boundary of the channel to locate the resistance levels at $51,000, $53,000, and $55,000 respectively.

BTC/USD Medium-Term Trend: Ranging (4H Chart)
On the 4-Hour chart, the Bitcoin price stays below the 9-day and 21-day moving averages, and the immediate support lies at the $45,000 level. However, the price may likely fall below the lower boundary of the channel if the bears stepped back into the market.
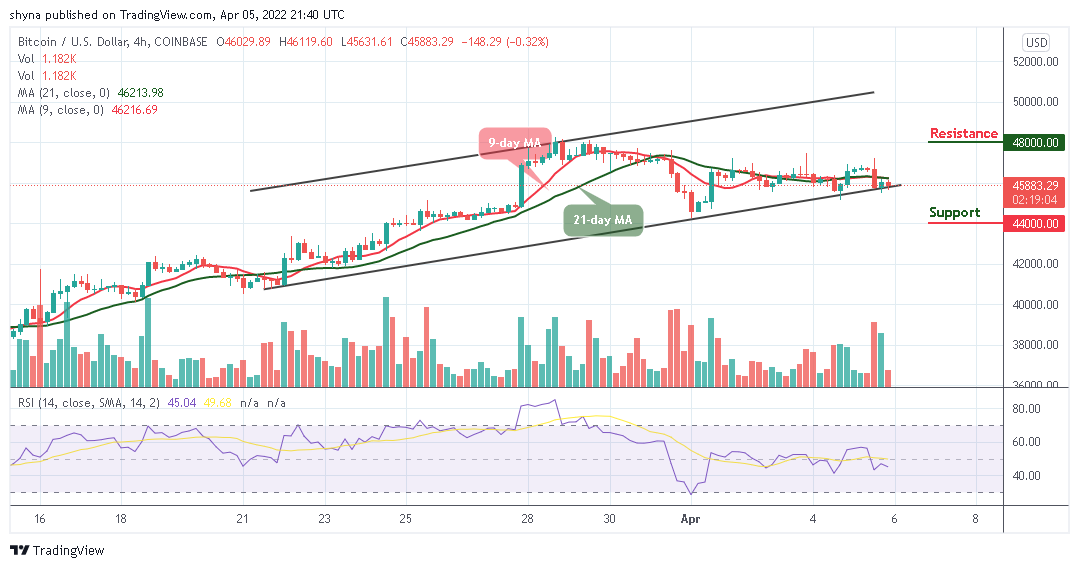
Nonetheless, a further bearish movement could test the critical support at the $44,000 level and below, while the resistance could be located above the moving averages at the resistance level of $48,000 and above. Meanwhile, the Bitcoin price is currently moving into the negative side as the technical indicator Relative Strength Index (14) remains below 50-level.
Looking to buy or trade Bitcoin (BTC) now? Invest at eToro!
68% of retail investor accounts lose money when trading CFDs with this provider
Read more: