Bitcoin Price Prediction – August 23
The Bitcoin price restarts the uptrend after crossing above the critical barrier of $49,000 to touch the daily high of $50,499.
BTC/USD Long-term Trend: Bullish (Daily Chart)
Key levels:
Resistance Levels: $55,000, $57,000, $59,000
Support Levels: $45,000, $43,000, $41,000

BTC/USD looks green today as the price hovers above the resistance level of $50,000 from the low of $49,100. However, a daily close above the $50,000 level may continue to increase the Bitcoin price to the higher highs. Meanwhile, traders should note that a consistent price increase may encourage more buyers to join the market as bulls could increase their positions.
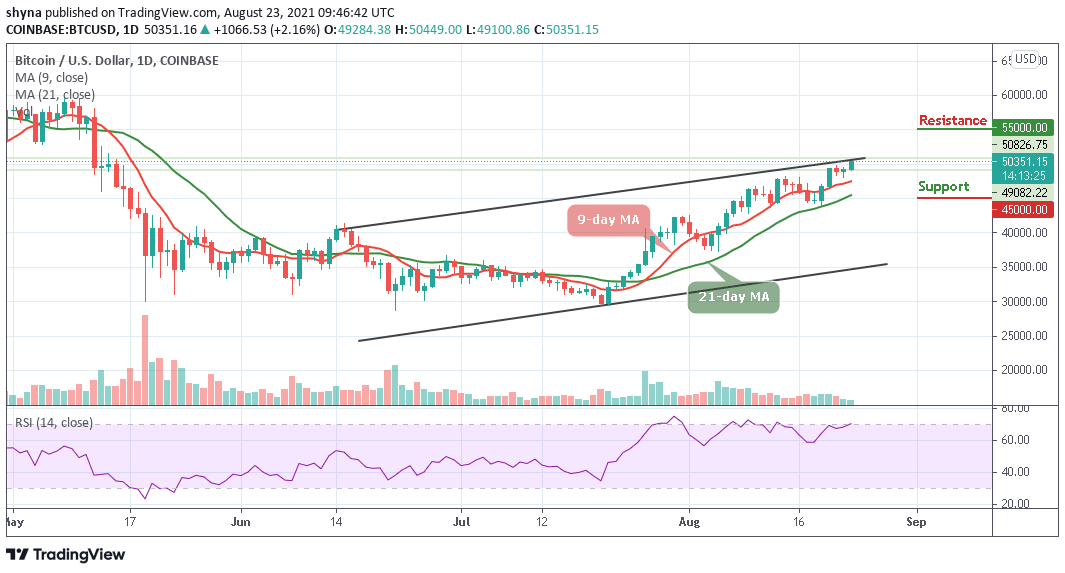
Bitcoin Price Prediction: Price May Reach $55,000 Resistance Soon
As reveals by the daily chart, the Bitcoin price hiked to a new weekly high touching the resistance level of $50,499 at the opening of today’s market. In the meantime, traders could see that the Bitcoin price may continue to converge above the upper boundary of the channel as the 9-day MA remains above the green of the 21-day MA which could take the coin to the higher highs. However, the Relative Strength Index (14) may cross into the overbought region in an attempt to create more bullish signals.
As the daily chart reveals, the first major resistance is near the $51,000 level while the main resistance is still near the $52,000 level. Therefore, a clear break above the $54,000 level could set the pace for a larger increase to $55,000, $57,000, and $59,000 resistance levels. On the contrary, should the Bitcoin price fail to stay above the $50,000 resistance, it could start a new decline as the initial support on the downside is near the $48,500 level. If there is a downside break below the $47,500 support and $46,000, the price could hit the support levels of $45,000, $43,000, and $41,000 respectively.
BTC/USD Medium – Term Trend: Bullish (4H Chart)
Looking at the 4-hour chart, BTC/USD is hovering at $49,152 as the price moves within the 9-day and 21-day moving averages. However, intraday trading is looking bearish as a cross below the 21-day moving average could hit the support level at $47,500 and below.

On the contrary, a climb above the upper boundary of the channel may push the BTC price to the resistance level of $51,500 and above. As it appeared now, it seems the bears may likely return into the market as the Relative Strength Index (14) is now revealed moving below 60-level, suggesting downward movement.
Looking to buy or trade Bitcoin (BTC) now? Invest at eToro!
75% of retail investor accounts lose money when trading CFDs with this provider