BCH?USD Market Dumps Close to $400 – September 28
The BCH/USD price trading situation experiences that the crypto market dumps closely to the level of $400. The market is at a depreciating value of around $486 with a smaller-negative percentage estimate of about 0.23. It seems that price is still under a falling force.
Market Dumps Close to $400: BCH Market
Key Levels:
Resistance levels: $600, $800, $1,000
Support levels: $400, $300, $100
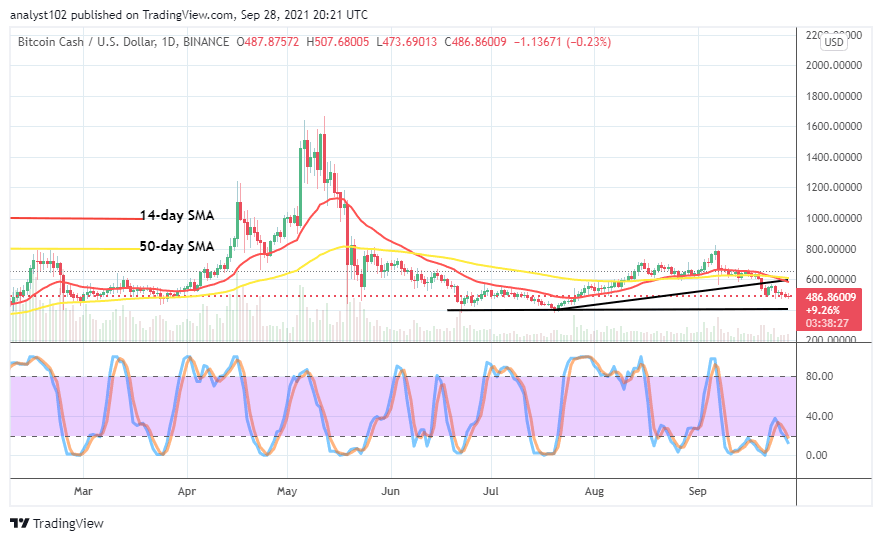
The BCH/USD daily chart pictures that the crypto market dumps close to the support line at $400 after a long-ranging movement of around $600. The 14-day SMA trend line has bent southbound, conjoining with the 50-day SMA trend line. The critical support baseline drew at the $400 line. The Stochastic Oscillators have crossed the lines to the south around ranges of 40 and 20. It appears that the crypto market may still, in a serial style, go down more on a lighter note.
When will there be a pump in the BCH/USD price Valuation as the market dumps close to $400?
A notable bullish engulfing candlestick needed to emerge at a point in time at a lower trading zone to count upon as the BCH/USD market dumps close to $400. In the recent past, the market had to undergo some degrees of recession sessions around a higher trading line at $600. Presently, the crypto-economic operations have moved down into lower range zones for a strong support baseline.
On the downside, the BCH/USD market short-position takers would have to maintain the current mode of slow and steady pushing posture for a while. Once there is a notable rebounding effort in the price motion after a sizeable number of lower-trading situations, sellers would need to settle for a put-off. As the market is getting dipper to the extreme, exertion of shorting positions should be wary.
BCH/BTC Price Analysis
The BCH/BTC price analysis chart showcases that the crypto pair market dumps in a smaller successive pattern beneath the trading indicators. The 50-day SMA trend line is over the 14-day SMA trend line as the bearish trend line gives a backing-resistance form to the bigger tool. The Stochastic Oscillators are in the oversold region with conjoined lines, indicating a consolidation moving style. That serves as a confirmation that the base crypto has not had the grand to regain any visible trending capability as paired with the flagship counter crypto.
Looking to buy or trade Bitcoin Cash (BCH) now? Invest at eToro!

67% of retail investor accounts lose money when trading CFDs with this provider.
Read more: