
Fantom (FTM) Price Prediction – August 4
There have been concurrent trading operations that suggest the Fantom market is in range spots against the US fiat currency. The market’s all-time low is $0.001953, and the all-time high is $3.48. The market now trades around $0.3583 at a percentage of 6.16 positives.
Fantom (FTM) Price Statistics:
FTM price now – $0.3583
FTM market cap – $916.5 million
FTM circulating supply – 2.6 billion
FTM total supply – 2.6 billion
Coinmarketcap ranking – #54
FTM/USD Market
Key Levels:
Resistance levels: $0.50, $0.70, $0.90
Support levels: $0.20, $0.15, $0.10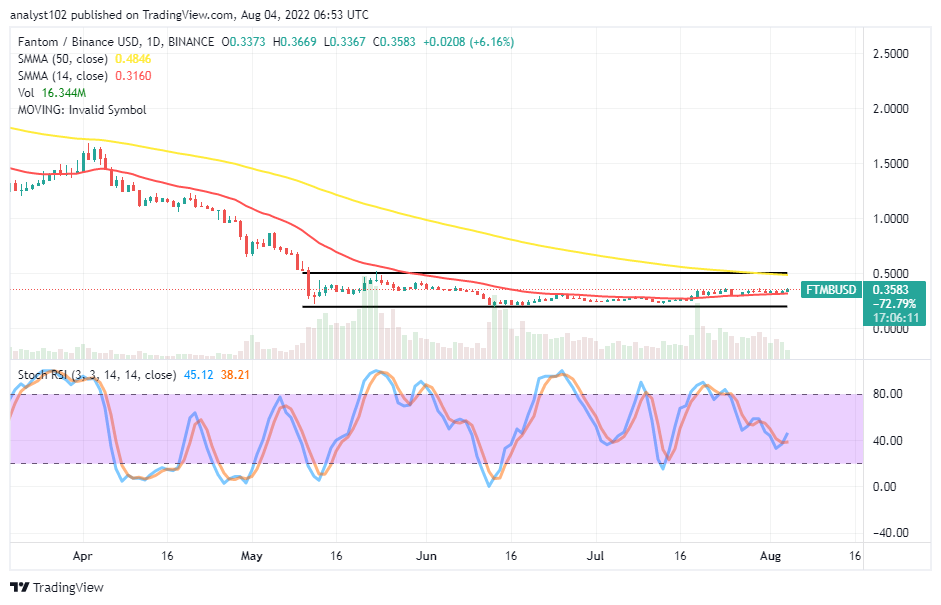 FTM/USD – Daily Chart
The daily chart showcases the FTM/USD market is in range spots demarcated by the drawing of an upper line at the $0.50 resistance level and the lower line at the $0.20 support level. The 50-day SMA indicator is closely placed around the upper horizontal range line at $0.4846 point over the 14-day SMA indicator as it is at $0.3160 within the range-bound zones. The Stochastic Oscillators have unwittingly swerved southbound to the range of 40, trying to cross back northbound at it.
Should traders keep looking for price weakness at the FTM/USD trade ranging side before exerting an order?
It would be technically okay for the FTM/USD market pair traders to keep looking for price weakness on the two range sides before deciding whether to buy or sell, as the crypto economy is in range spots. Bulls are to continue to build energy around the 14-day SMA trend line closely over the lower range line at $0.20. A breakdown at the value line may expose the base economy to the risk of witnessing more drops in pursuance of such an act. Therefore, buyers need to exercise patience if that eventually occurs.
The downside of the technical analysis suggests the FTM/USD market portrays a long-range trading outlook. Bears may be getting a hold of the market around the $0.50 upper range line if bulls get weakened to push higher past the point. The Stochastic Oscillators can also serve as an instrument to decide when to begin to look for a sell order when they are positioned at higher range spots to denote a resumption of a downward trend, bending toward the southbound afterward.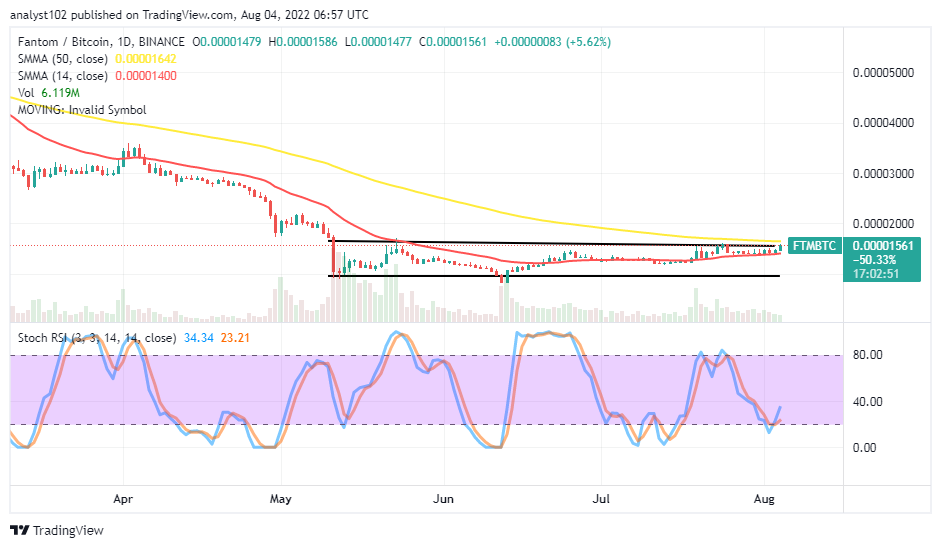
FTM/BTC Price Analysis
Comparing the trending capacity of Fantom with that of Bitcoin, the former is in range spots against the former to signify that it’s struggling to regain its stance to the upside. The 14-day SMA indicator is lying flat underneath the 50-day SMA indicator. And they are keeping the upper range spot closely within themselves. The Stochastic Oscillators are around the range of 20, trying to cross back northbound in the 20 and 40 range points. That shows the base crypto is not yet giving in to a decline from its counter crypto currently.

Battle Infinity – New Crypto Presale
- Presale Until October 2022 – 16500 BNB Hard Cap
- First Fantasy Sports Metaverse Game
- Play to Earn Utility – IBAT Token
- Powered By Unreal Engine
- CoinSniper Verified, Solid Proof Audited
- Roadmap & Whitepaper at battleinfinity.io
Read more: